

Recent industry primers: Aerospace, Exchanges, Insurance, Regional Banks.
We are delighted to share with you the fifth in-depth research report in our Industry Primers series, this one on homebuilding. The series exists to help fundamental, long-term investors expand and deepen their circle of competence, one industry at a time, and your feedback on what was useful and on which industries to cover next shapes what we produce. The report is complemented by two podcast episodes, the first telling the story of the industry and the second digging deeper into the fundamentals from an investor's standpoint. Below, you will find two PDF files for download: the research report (members only) and the accompanying slide deck (free to access). We start with a quick anecdote:
Dwight Schar founded NVHomes in 1980 and in 1987 bought his old employer, Ryan Homes, with more than $450m of debt. The combined company, NVR (NYSE: NVR), filed for bankruptcy on April 6, 1992, and it failed on that debt while its buyers kept closing on their houses. It came out of Chapter 11 on September 30, 1993 and stopped owning land. Since then it has bought finished lots from developers under option: it pays a deposit of at most a tenth of the lot's price for the right to purchase the lot when it is ready to build, and in a downturn it can walk away and lose only the deposit. In Schar's words to HousingWire in April 2026, NVR "optioned the lots from the developers."
From the emergence to Schar's retirement from the board in May 2022, NVR compounded at 23.9% a year with dividends reinvested, against 10.2% for the S&P 500 total return. At those rates $10,000 became about $4.57m in NVR and about $162,000 in the index. By June 30, 2026 NVR had retired 17,877,177 of the 20,555,330 shares it had ever issued. Over the twenty years to September 18, 2026 it returned 13.0% a year, while Hovnanian Enterprises (NYSE: HOV) lost 8.9% a year. NVR held options and net cash through the bust, and Hovnanian's book equity was negative at every fiscal year end from 2010 to 2020.
The report explains the gap through the way a builder earns its return. A homebuilder acquires land, or an option on it, turns it into finished lots over one to five years, builds each house in about four months and is paid at closing, when the buyer's mortgage funds. Its return on equity is its pretax margin times its inventory turns (revenue divided by inventory) times its inventory per dollar of equity, and the terms after the margin decide most of it.
In FY2025 NVR and D.R. Horton (NYSE: DHI) earned almost the same gross margin, 21.2% and 22.3%. NVR's return on average equity was 33.2% and D.R. Horton's 14.5%. NVR's inventory, houses on lots bought weeks earlier, turned 5.46 times in the year, against 1.36 times at D.R. Horton, and at D.R. Horton's turns NVR would have earned about 8% on its equity. The option also limits the loss. In the five years from 2006 NVR wrote off about $654m of deposits, 57% of its equity at the end of 2006, and it still earned a profit every year.
The monthly payment decides how much house a buyer can afford. In mid-September 2026 the average 30-year mortgage rate was 6.95%. At that rate a $400,000 loan costs $2,648 a month, and one point of rate changes the payment by $262. That is why the large builders run their own mortgage lenders: D.R. Horton's lender financed 81% of the homes it closed in FY2025.
The record shows how rare NVR's result is. Kenneth French's construction portfolio, which mixes homebuilders with contractors, compounded at 8.7% a year over the century to July 2026, against 10.4% for the US market. Of the 27 builders and land developers listed in the United States in 2005, six failed in or through Chapter 11, and about a third lost most or all of their equity. Single-family starts fell 81% from January 2006 to March 2009. Over the twenty years to September 2026 NVR was the only one of nineteen listed builders to beat the S&P 500 total return.
The best records belong to a few owner-operators who owned little land with debt before the busts, had cash when land was cheap and reduced their share counts. D.R. Horton returned 21.7% a year under David Auld as chief executive, from 2014 to 2023, against 11.3% for the index. PulteGroup (NYSE: PHM) has returned 20.2% a year under Ryan Marshall since 2016, against 15.2%.
The report finds that the variables behind those records were in the filings in advance: the share of lots owned and the debt behind them, the cash held for a downturn and the price paid for buybacks. This primer is a manual for reading them. This is one of a weekly series of primers whose purpose is to help readers expand or deepen a circle of competence, one industry at a time.
The companion deck. Homebuilding: a self-contained summary of the report in slide form.

What's inside
The primer has two parts, both attached to this post: the report and a companion deck that can be read on its own. The report follows the industry from its history and economics to its companies, its accounts, its valuation and its open questions, and every figure in it is dated and sourced in the notes. The highlights, part by part:
Part I, Orientation. What a homebuilder is, how it earns its return and where the industry sits in the world. Americans started 939,700 single-family houses in 2025, and 72% of them were built for sale by a builder that controlled the lot. Seven Sunbelt states issued 51.0% of the country's single-family permits that year, Texas alone 15.4%.
The 34 listed companies the primer features were worth about $217bn at the close of Friday, September 18, 2026. About 39% of that value sits outside the United States. D.R. Horton, at $38.6bn, is the most valuable listed homebuilder among them. Chapter 2 follows NVR and D.R. Horton side by side from the land to the closing, and shows why buying lots under option limits a builder's loss in a downturn to its deposits. The listed American group is shrinking. Four listed builders have passed to other owners since June 2025. The last was Taylor Morrison, which Berkshire Hathaway (NYSE: BRK.A, BRK.B) bought on July 24, 2026 for about $6.8bn of equity.
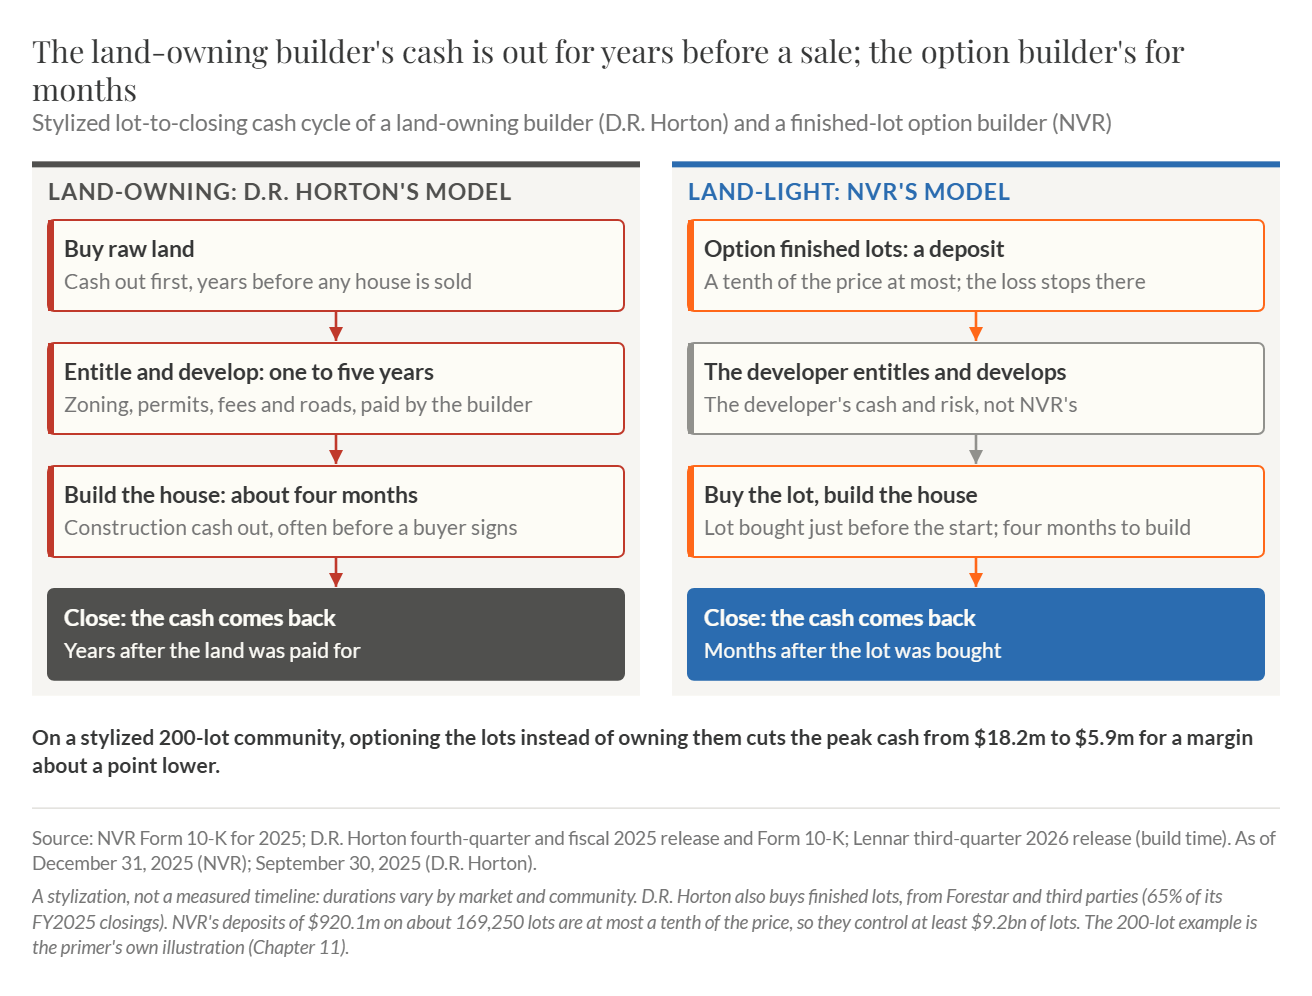
From Chapter 2: the cash cycle of a builder that owns its land (D.R. Horton) beside one that buys finished lots under option (NVR), drawn as a stylization rather than a measured timeline. On the 200-lot community the report works through, buying the lots under option cuts the peak cash from $18.2m to $5.9m, for a margin about a point lower.
Part II, Evolution. Ninety years of American homebuilding told as a series of credit cycles, with the British, Japanese and Chinese builders beside them. The Federal Housing Administration, created on June 27, 1934, insured long, fully amortizing loans, so that a buyer could pay for a house in monthly installments over decades. A Levittown house of 1950 cost $7,990, or $56 a month for a veteran. The busts that followed each started when credit tightened. At the rate of April 1971 each $1,000 of a thirty-year loan cost $6.88 a month. At the peak of October 1981 it cost $15.59, so a household with the same budget could borrow 44% as much.
After 1992 the listed builders used the bond and stock markets to acquire one another and to add land, and the bust that followed took 81% off monthly starts. In November 2007 Lennar (NYSE: LEN, LEN.B) sold about 11,000 homesites carried at about $1.3bn for $525m. That price, about 40 cents on the dollar, shows what a seller in need of cash could get for land at the low point.
The survivors then bought their lots under option instead of owning them. Lennar owned four-fifths of its lots in 2010 and fewer than 2.5% of about 488,000 homesites in September 2026, after spinning off its land into Millrose Properties (NYSE: MRP) in 2025. The record-low mortgage rate of 2.65% in January 2021 gave the builders the best margins in their history, 28.8% on D.R. Horton's home sales in fiscal 2022. The rise in rates that followed lifted the monthly payment on a $400,000 loan from about $1,612 to $2,648.
Chapter 8 tells four cases as the decisions their institutions took. The first is NVR's bankruptcy and the way of buying lots that came out of it. The second is TOUSA, whose joint venture paid $826.2m for Transeastern Properties, a Florida builder, in August 2005; TOUSA filed for Chapter 11 on January 29, 2008. The third is Persimmon (LSE: PSN) under the British government's equity loans to buyers of new homes, offered from 2013: its underlying operating margin rose from 21.9% in 2015 to 30.8% in 2018 and fell to 14.0% in 2023 as the subsidy ended. The fourth is China Evergrande, whose buyers paid before their apartments were built and became its largest creditors.
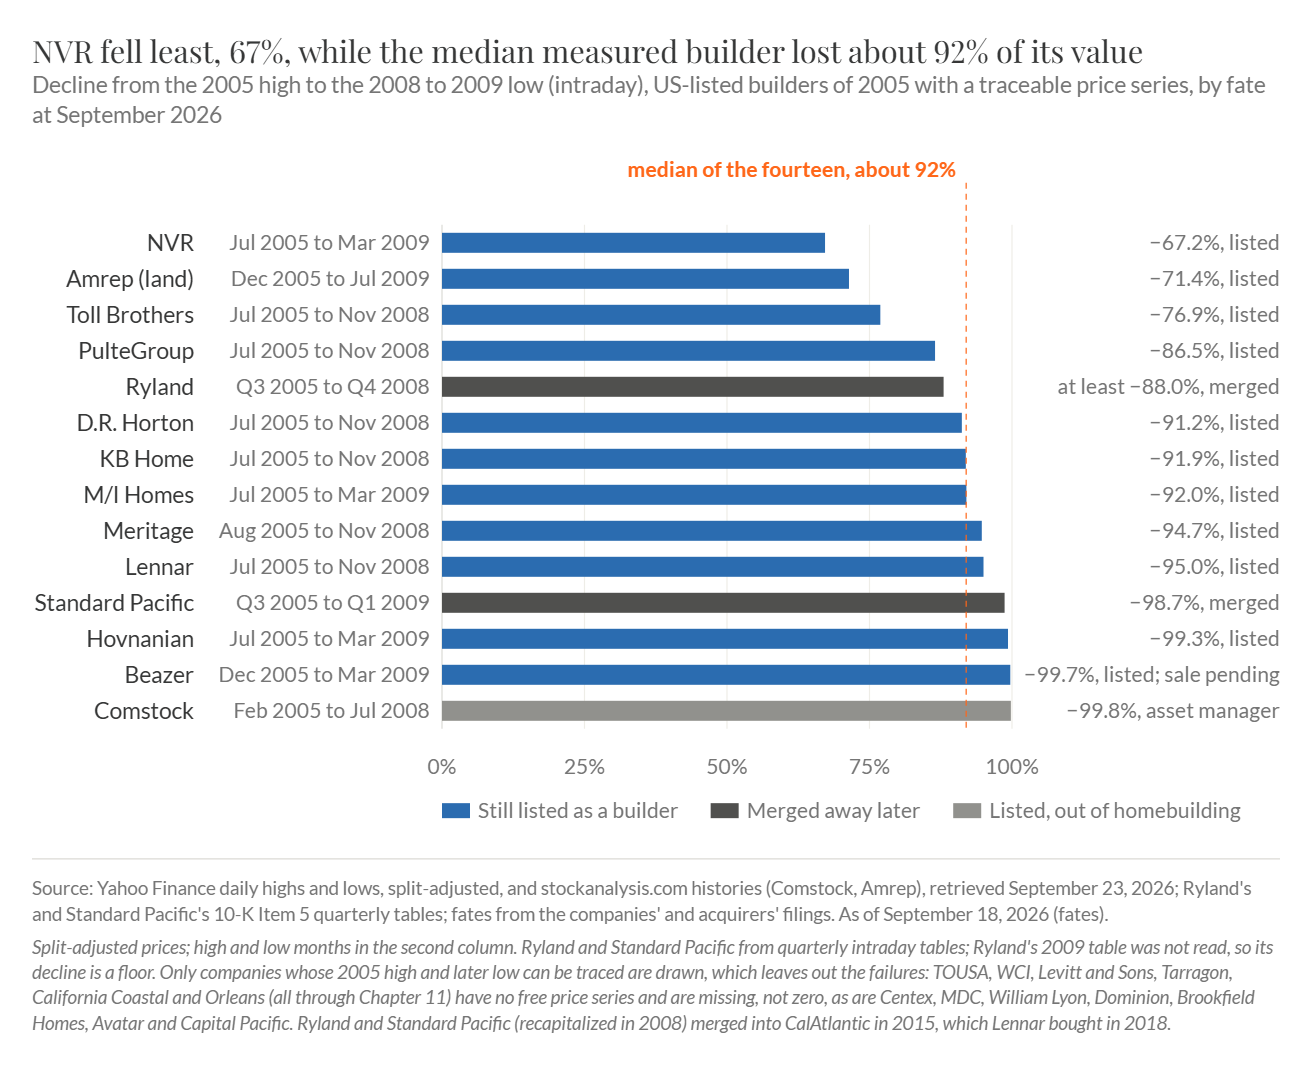
From Chapter 5: each listed builder's fall from its 2005 high to its 2008 to 2009 low, with what became of it by September 2026. NVR fell least, 67%, while the median of the fourteen builders with a traceable price series lost about 92%; the six that failed through Chapter 11 have no free price series and are not drawn.
Part III, Structure & Economics. Where the profit goes, how the cycle works, what a house, a community and a balance sheet earn, and which advantages have lasted. In a boom most of the profit on a new home goes to the landowner, and in a bust it goes to the builders with cash to buy land cheaply. The National Association of Home Builders' 2024 survey put construction at 64.4% of a new home's price and the finished lot at 13.7%.
A builder works out what it can pay for a lot by subtracting its construction cost, its other costs and its profit from the price buyers can pay. On a $400,000 house the survey's shares leave $55,200 for the lot, and if buyers can pay 10% more at the same construction cost, $86,480 is left. A 10% rise in house prices therefore lets the builder pay 57% more for the lot, and competing builders pass that gain to the landowner. The mortgage arm is a second source of profit: financial services earned 21.8% of Lennar's pretax income in FY2025.
The average 30-year mortgage rate rose 69 basis points in the year to September 17, 2026, so a household with the same monthly budget can borrow about 7% less. In July 2026 the Census Bureau counted 9.6 months' supply of new homes, a level last seen in the bust, while estimates of the national housing shortfall run from 3.7 million to 5.5 million homes. The report reconciles the two readings. The shortfall is a national count of missing homes at today's prices, and months' supply measures unsold new homes at today's monthly payments, concentrated in the markets where the builders built fastest. The builders have answered with incentives, above all by paying to lower the buyer's mortgage rate. A one-point cut in the rate gives the buyer about 2.75 times the monthly relief of the same money taken off the price.
Chapter 13 finds no durable competitive advantage in the industry. The ten largest public builders' closings rose from 22.6% of Census new-home sales in 2005 to 43.7% in 2025, yet the two largest, D.R. Horton and Lennar, earned 14.5% and 8.3% on their equity in FY2025. The one advantage that has lasted, holding less land and less debt than competitors, depends on the managers who keep to it.
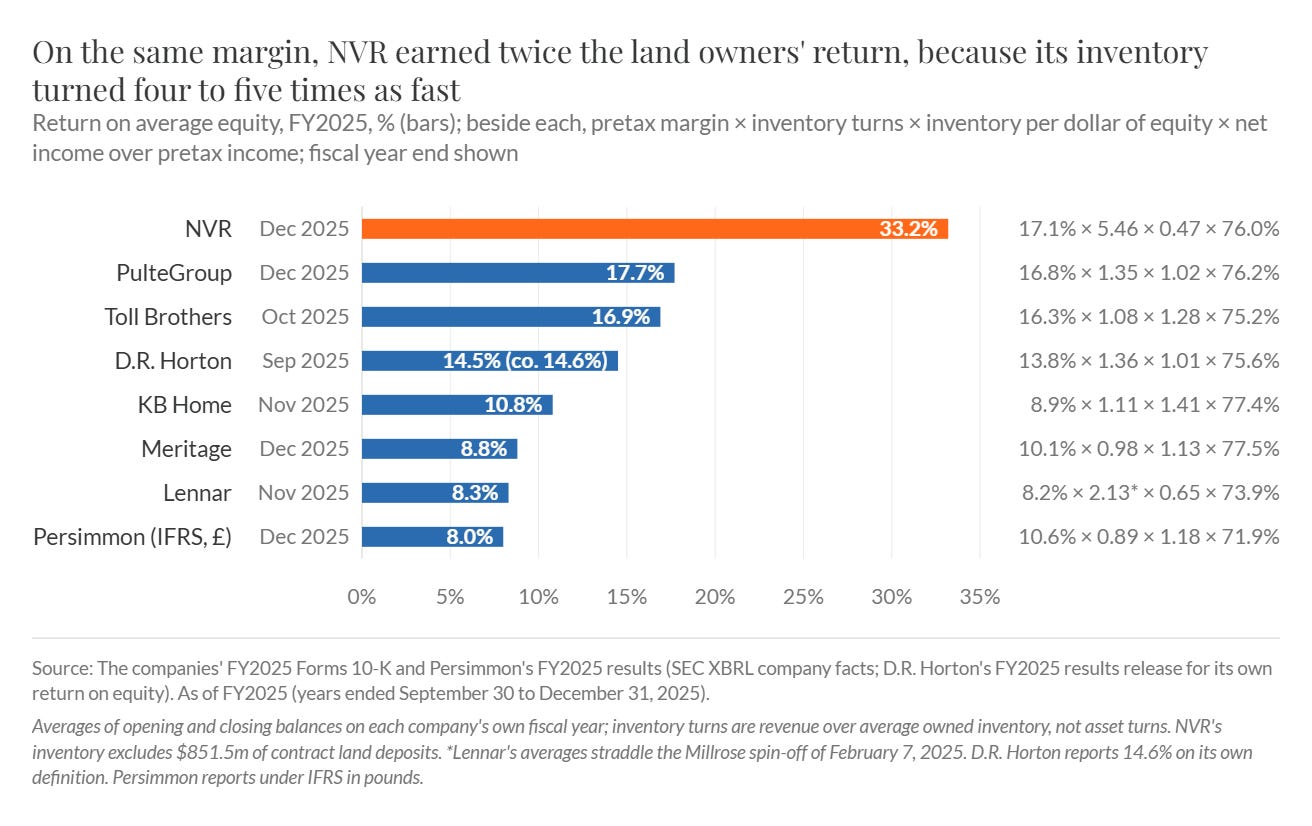
From Chapter 11: return on average equity in FY2025 for seven American builders and Persimmon, each broken into pretax margin, inventory turns, inventory per dollar of equity and the share of pretax income kept after tax. NVR earned 33.2% on a 17.1% pretax margin because its inventory turned 5.46 times, against 1.36 times at D.R. Horton.
Part IV, The Players. The featured companies on one page at one date, two chapters on the owner-operators and the capital allocators, and the owners and rules outside the stock market. At the September 18, 2026 close eight of the fourteen American production builders traded below book value. PulteGroup has retired 45% of its shares since 2016 while holding net cash.
The owner-operator chapters put every record on one basis, total shareholder return with dividends reinvested over each tenure, against the S&P 500 total return over the same dates. Donald R. Horton told the trade magazine Professional Builder in December 1999: "Walk through the builder graveyard and all the tombstones read 'long and wrong on land.'" His company returned 16.6% a year from its 1992 listing to his death in May 2024, against 10.45% for the index. Robert Toll said publicly in December 2005 that the market had softened and then walked away from thousands of optioned lots, and the shares of Toll Brothers (NYSE: TOL) fell 76.9% from the 2005 high to the low of the bust, against about 92% for the median measured builder. In 2016 William J. Pulte, PulteGroup's founder, whose group held about 9.0% of the shares, forced a change of chief executive.
In Britain Tony Pidgley of Berkeley Group (LSE: BKG) stated his rule as a ratio to the journalist Peter Bill in February 2012: "If the land is 10% of the sum total, you've got a chance. If it becomes 50% or 60%, as it does at the top of a boom, you've got no chance." In February 2009 Berkeley dropped the rest of a promised cash return and sold £49.6m of new shares at £8.40 to purchase land after prices had fallen. It then promised £13 a share over ten years and paid it. The companies' own documents record the failures. TOUSA's chief executive, Tony Mon, wrote in June 2007 that the company would be "[u]nable to survive should housing conditions degrade further." Persimmon's incentive plan of 2012 had no cap and paid its chief executive £45.7m for 2017.
The report judges buybacks by the price paid. Weighted by the dollars spent, Toll Brothers bought back its shares at an average of about 1.27 times book at its year ends, and NVR at 5.1 times. At D.R. Horton's FY2025 multiple of 2.06 times book, each dollar it spent retired about 49 cents of book value.
Chapter 17 covers the private builders and those owned by larger companies. The private and outside-owned builders closed about 94,800 homes in 2025, about 14% of Census new-home sales. The American homebuilding business of Sekisui House (TSE: 1928), the largest Japanese buyer of American builders, lost ¥12.5bn on ¥413.5bn of sales in the six months to July 2026.
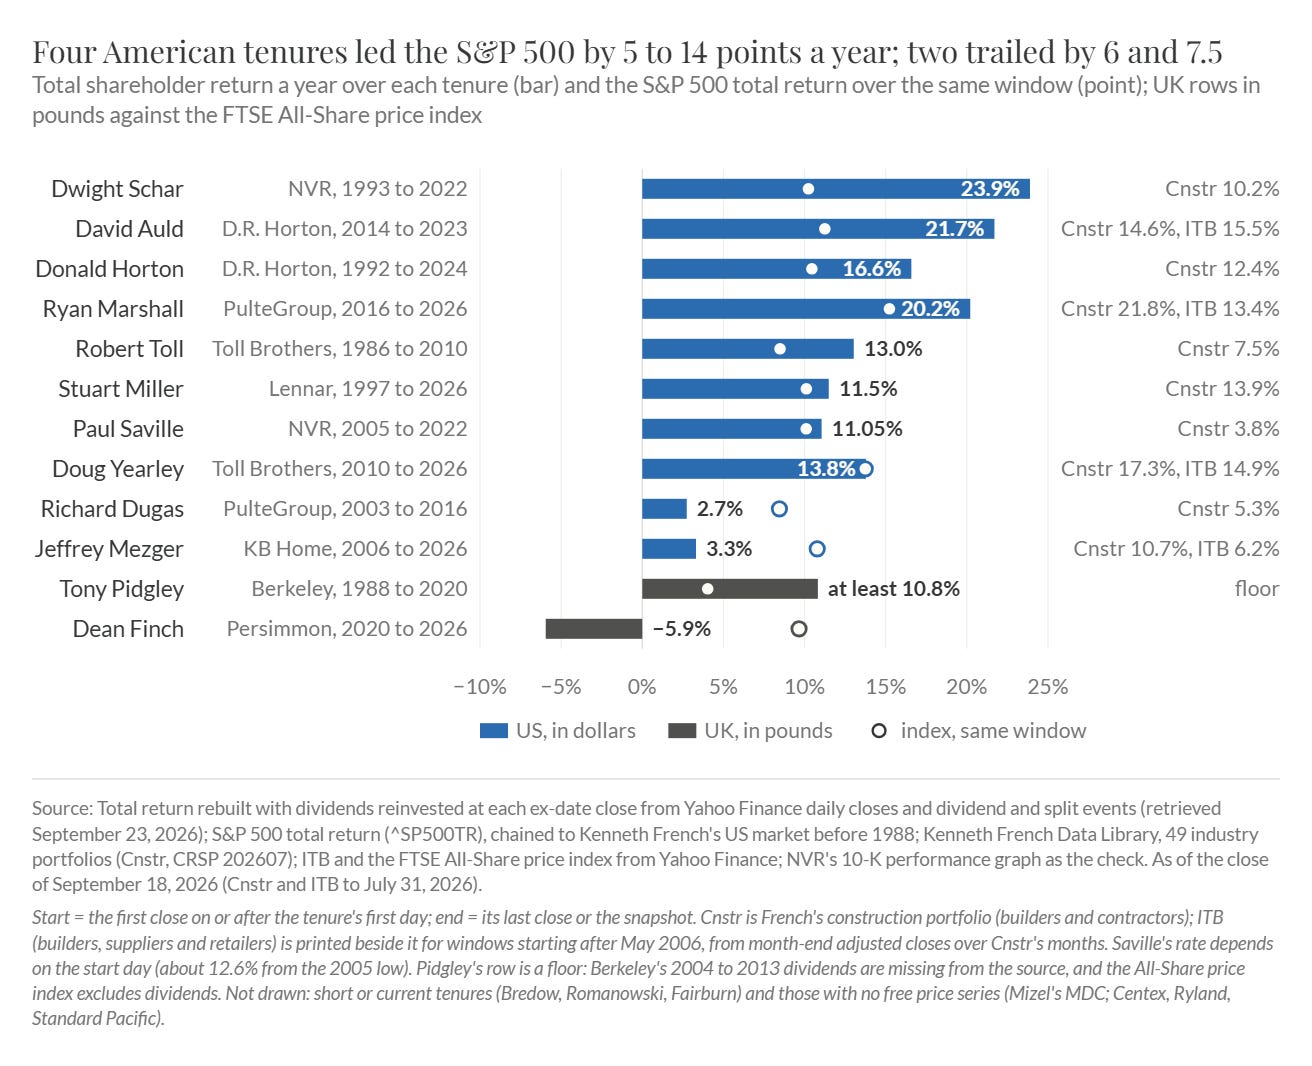
From Chapter 16: total shareholder return a year over each leader's tenure, with dividends reinvested, against the S&P 500 total return over the same window (the British rows in pounds, against the FTSE All-Share price index). Dwight Schar's NVR returned 23.9% a year from 1993 to 2022, against 10.2% for the index.
Part V, Speaking the Language. Part V is the reference section: the vocabulary and its competing definitions, the accounting that turns land bought years earlier into this year's margin, and a tour of the filings and the public data in the order the questions arise. The filing states which margin and which lot count is in use. D.R. Horton's FY2025 gross margin was 23.7% consolidated, 22.3% on home sales before charges and about 21.7% after them. The capture rate, the share of a builder's buyers who take their mortgage from its own lender, was 85% of PulteGroup's financed closings and 64% of all its closings in the second quarter of 2026.
Under US rules a write-down of land to its fair value, an impairment, is never reversed, while the British builders reverse theirs under international rules. Interest on the money borrowed to carry land is added to the land's cost and reaches the income statement only when the house closes. It took 4.1% of PulteGroup's home-sale revenue in 2010 and about 0.7% in 2025.
Options keep a builder's commitments outside its reported debt: NVR's $920.1m of deposits controls at least $9.2bn of lots, none of them on its balance sheet. British builders often pay for land on deferred terms and report what they owe as land creditors. Counting its £623.4m of land creditors turns Persimmon's £117.0m of net cash into net debt.
The filings also show the coming year in advance. NVR's backlog of homes sold but not yet closed fell 15% in 2025, so 2026 opened with fewer homes already sold. By July 2026 D.R. Horton had cut its fiscal 2026 closings guidance to about 3.4% below its October 2025 range.
Part VI, Analysis & Valuation. The analysis from the land upward, price to book against return on equity, the prices paid for whole builders and the base rates. Chapter 21 starts with the markets and the land: how many years of closings a builder owns, when it bought that land and how much of its equity a write-down would take, and only then the margin. Per dollar of average inventory, NVR earned about 93 cents of pretax profit in FY2025 and D.R. Horton about 19 cents.
The market prices a builder on its book value and on the return that book earns through a cycle, because its balance sheet is mostly land, lots and houses carried at cost. At the September 18, 2026 close, a line fitted across fifteen US builders and land developers, NVR excluded, crosses one times book at a return on equity of about 11%. The five large builders traded at a median of 1.62 times book, against 1.59 at their fiscal year ends over thirty-one years. NVR's 4.83 times book reflects a small book more than a high price, since it trades at 15.6 times trailing earnings.
A low price relative to earnings has misled buyers when the earnings came from land bought with debt near the top. At the fiscal 2005 year end D.R. Horton traded at 7.7 times earnings, and its shares then lost 28.8% a year for three years. At the fiscal 2022 year end four of the five large builders traded at 3.7 to 5.5 times earnings, and they returned 17% to 47% a year over the next three years. They held most of their lots under option and had spent the good years' earnings on their own shares rather than on land.
Since 2017 buyers of whole builders have paid 1.1 to 1.4 times book for a healthy builder and less than book for a weak one. Berkshire paid 1.09 times book for Taylor Morrison, which earned 12.9% on its equity, close to the 1.10 times the fitted line gives for that return. Chapter 23 sets the base rate: a buyer of a listed builder in September 2006 had about one chance in nineteen of beating the index by 2026, and that chance lay in the builder that owned the least land. The report treats the evidence that owner-operators outperform as suggestive rather than proven, because it rests on a handful of companies and one great bust.
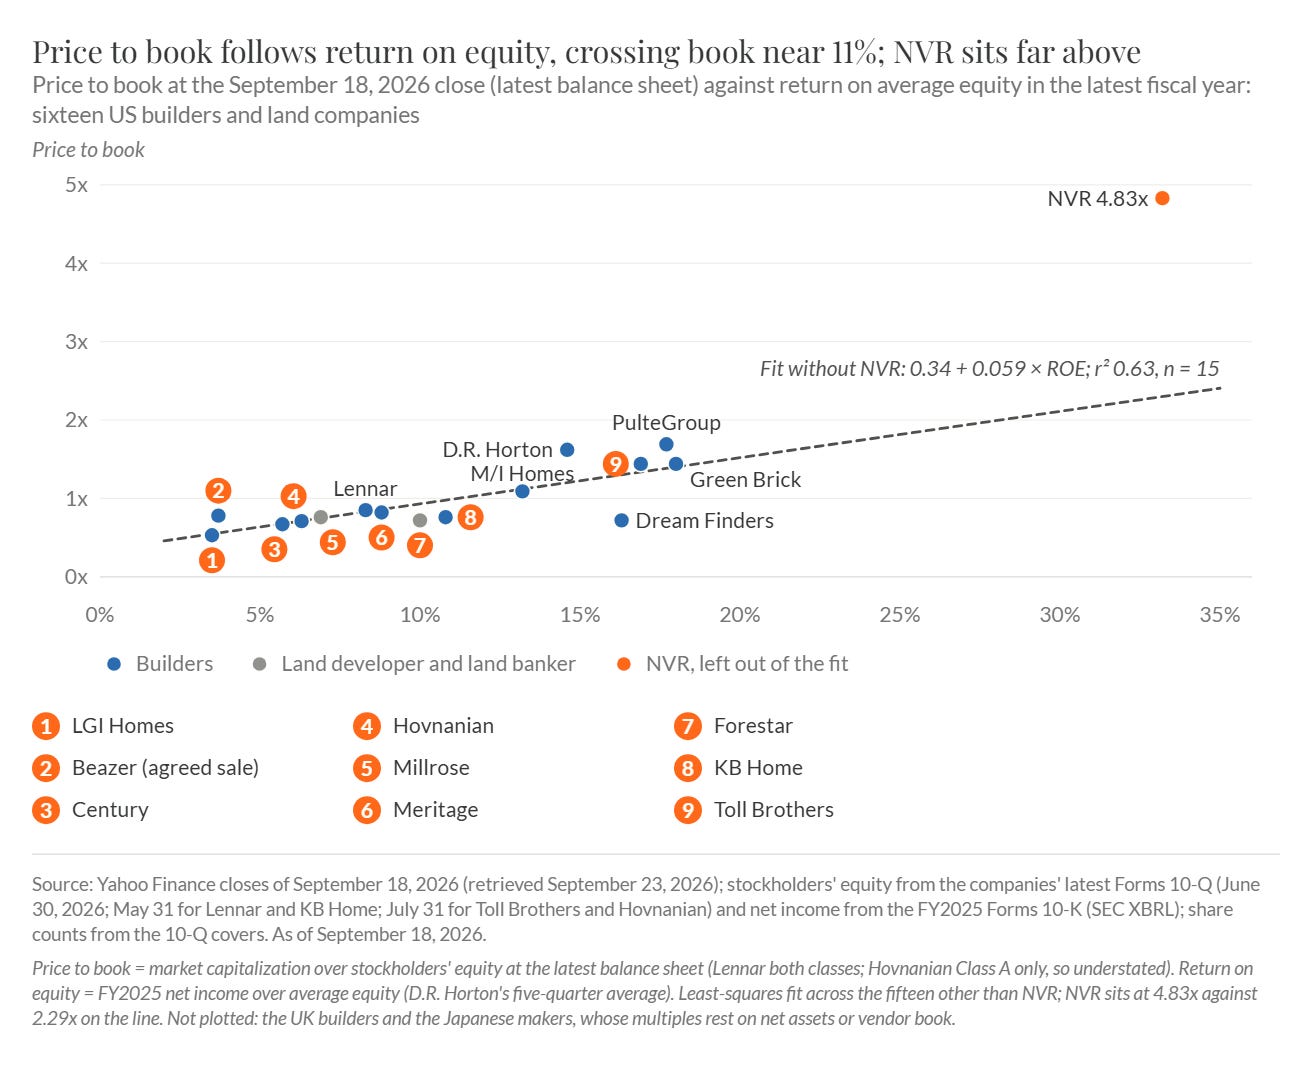
From Chapter 22: price to book at the September 18, 2026 close against return on average equity in the latest fiscal year for sixteen US builders and land companies, with the line fitted across the fifteen other than NVR. The line crosses one times book at a return of about 11%, and NVR sits at 4.83 times book against 2.29 times on the line.
Part VII, The AI Inflection. The part counts only claims that carry a number, a date and a base. The phrase "artificial intelligence" appears in 14 of the 19 annual reports for fiscal 2025 filed by the US builders, as a risk factor, and only Lennar publishes numbers. Its cycle time, the days it takes to build a house, fell to 116 days in the quarter to August 31, 2026 from 126 a year earlier, a gain it also credits to starting houses at an even pace. Its selling, general and administrative expense rose to 9.2% of home-sale revenue from 8.2%, about $78m more in the quarter than at the old ratio, so the spending has raised its overhead before any saving shows.
Attempts to build houses in factories have not changed how most houses are built since the federal factory program of 1969: Katerra raised close to $3bn of equity and filed for Chapter 11 in June 2021. The largest effect so far runs through labor. Electricians' hourly pay rose 7.4% in the year to July 2026, against 5.2% across construction, as data centers competed for them. If D.R. Horton cut its overhead by one point of revenue, its pretax income would rise by about $314m, about 7% of what it earned before tax in fiscal 2025.
Part VIII, Risks & Debates. In every homebuilding failure the report records, the builder owned land bought with debt when credit tightened. The joint venture, the condominium tower and the presale moved the debt to where the parent's balance sheet did not show it. Texas and Florida issued 27.5% of the country's single-family permits in 2025, so a slowdown in those two states now reaches most of the large builders at once.
In September 2026 the numbers a builder controls, its incentives and its deposit write-offs, are rising, while cancellations and debt remain near their lows. Lennar's incentives ran at about 12% of the price, against the 4% to 6% Stuart Miller calls normal. NVR wrote off $75.9m of deposits in 2025 and about $21.7m more in the second quarter of 2026. The Federal Reserve raised its target range on September 16, 2026, its first increase since 2023.
Chapter 27 sets out eleven debates, each with the facts first, the proponents named and the number that would settle it. On incentives, each point of Lennar's margin is worth about $84m of gross profit next quarter. On September 16, 2026 Miller described an environment "which has deteriorated since our last earnings call." On the cost of the option, Hunterbrook Media estimates that Lennar pays Millrose an average of 8.5% a year, about what Lennar's equity earned in FY2025. The holders of Beazer Homes USA (NYSE: BZH) vote on the cash offer from Dream Finders Homes (NYSE: DFH) on Thursday, October 15, 2026, and most of the numbers that would settle the debates arrive between October 20 and November 16.
The appendices. The investable universe, 94 listed companies in 17 countries with their listings and the unlisted builders, land sellers and owners set out beside them; a checklist of 36 questions for the analyst, in eleven sections, in the order of the analysis of Chapter 21, with the place to look and what the record shows for every question; a reading course that opens with the builders' own letters and calls, followed by books, the government, regulatory and court records, interviews and the data series; and the numbered notes that source the report.
The companion deck. The report in the format of the Monday Morning Briefing, designed to be read without the report: the propositions of the Executive Summary with the number that carries each, the report's exhibits re-rendered for the slide format under titles that state what each shows, the tables that carry the argument, and slides for material that has no exhibit in the report, followed by the universe and the checklist.
What the primer is for. A reader who works through it should be able to explain how homebuilding makes money, from the margin on the house and the speed at which the land turns to the builder's own mortgage lender; use the industry's vocabulary, from the lot option and its deposit, the backlog and the cancellation rate to the capture rate, capitalized interest and the British land creditor; read the filings without being misled by a gross margin quoted on the wrong basis, a count of "controlled" lots taken for lots owned, a net order count without its cancellation rate or a net cash figure that leaves out land bought on deferred terms; appraise a builder the way specialists do, from the land upward in the sequence of Chapter 21 and against price to book, the return on equity and the prices paid for whole builders; and recognize the managers and business models that have compounded value over decades, and the ones that bought land with debt at the top of the cycle.
How to use this primer
The report does not need to be read in order. Suggested paths:
a generalist with limited time, Parts I and VI plus the checklist in Appendix B;
a reader interested in the history, Part II;
an accountant, Part V with Chapter 11;
an analyst working on a specific company, Chapter 14, then Parts III, V, and VI in order;
a risk officer, Part VIII with Chapters 5 and 8;
a technologist, Part VII;
a reader who came for the owner-operators, Chapters 15 and 16, with Chapter 23 for what their records are worth against the index.
Every chapter ends with a "What to remember" box, and the twenty-seven boxes read in sequence summarize the report. The checklist follows the order of the analysis in Chapter 21, and its first eight questions test the risk in the land, because from 2006 to 2011 the large American builders wrote off between 57% and 140% of their 2006 book equity, and the charges came from land held into the downturn.
Feedback and requests
Please reply to this email or leave a comment with what was useful, what was missing, any errors you find, and the industries you would like covered next. Member requests will inform the order of coverage.
The complete report and the deep-dive audio program are part of the Latticework Premium membership, together with the full weekly slide decks and the archive of past primers. For investment firms, the Institutional tier adds membership in MOI Global (subject to approval) and exclusive firm-building content and best practices. Both are on the subscribe page.
This content is published by MOI Global for educational purposes only. It is not investment advice, an offer, or a solicitation, and no security mentioned herein is recommended for purchase or sale. The publisher and contributors may hold positions in securities discussed. Figures are believed accurate as of the dates stated but are not warranted; readers should verify all data against primary sources before relying on it. Nothing herein constitutes legal, tax, or accounting advice.