

We are delighted to share with you the fourth in-depth research report in our Industry Primers series, this one on aerospace. The series exists to help fundamental, long-term investors expand and deepen their circle of competence, one industry at a time, and your feedback on what was useful and on which industries to cover next shapes what we produce. The report is complemented by two podcast episodes, the first telling the story of the industry and the second digging deeper into the fundamentals from an investor's standpoint. Below, you will find two PDF files for download: the research report (members only) and the accompanying slide deck (free to access). We start with a quick anecdote:
At the close of September 18, 2026, GE Aerospace (NYSE: GE) was worth $326.1bn, about as much as The Boeing Company (NYSE: BA) at $156.7bn and Airbus SE (Euronext Paris: AIR) at $175.6bn together, on FY2025 GAAP revenue of $45.9bn against Boeing's $89.5bn. Rolls-Royce Holdings (LSE: RR.), at $159.5bn, was worth slightly more than Boeing on the same date. The two Western makers of large jets are valued below the makers of the engines that hang on them because in this industry the money is made after the airplane is delivered, and the products last longer than most of the companies that make them.
The 737 first flew on April 9, 1967, and Boeing delivered 447 more in 2025. CFM International, the joint company of General Electric and Snecma (today GE Aerospace and Safran (Euronext Paris: SAF)), was incorporated in 1974, and its CFM56 engine was still delivered 52 times in 2025. TransDigm Group (NYSE: TDG) states in its 10-K that its parts have "an estimated product life cycle in excess of 50 years." Among the large companies, market value per dollar of latest fiscal-year revenue ran from 1.8 at Boeing to 6.8 at TransDigm and 11.1 at Howmet Aerospace (NYSE: HWM).
The report explains the gap through three businesses that are paid at different points in an aircraft's life. An airframe program spends tens of billions of dollars and most of a decade before its first delivery and builds its early units at a loss; under program accounting Boeing carries the excess cost of those units in inventory, and the 787's deferred production costs peaked at $28,510m at the end of 2015 and stood at $14,428m at June 30, 2026. In 2025 Airbus's commercial aircraft business earned a 10.4% margin on its own adjusted measure on 793 deliveries, while Boeing Commercial Airplanes lost $7,079m on $41,494m of revenue, a GAAP loss of 17.1%, on 600.
An engine maker sells the engine at a thin margin and is repaid over the shop visits, the scheduled overhauls of the following decades: services were 75.1% of the $33,314m of revenue at GE Aerospace's Commercial Engines & Services in 2025, a unit that earned a 26.6% margin. The owner of a proprietary part, one that it alone is certified to supply, prices it against the cost of a grounded airplane: in the year to September 30, 2025 TransDigm earned EBITDA As Defined, its own non-GAAP measure, of 53.9% of net sales (47.2% on GAAP operating income), with about 55% of sales from the aftermarket.
The record follows the same order. Kenneth French's value-weighted portfolio of US-listed aircraft, engine and parts makers compounded at 12.8% a year from July 1926 to July 2026 against 10.4% for the market, with deeper falls and losing decades. Over the twenty years from September 29, 2006 to September 18, 2026, with dividends reinvested, TransDigm returned 27.1% a year, HEICO (NYSE: HEI, HEI.A) common stock 21.1% and Safran 17.6%, against 11.2% for the S&P 500 total return, while Airbus returned 12.3% and Boeing 6.5%, and five of the seven listed airframers sit in the bottom third of that board.
The largest fortunes were made by capital allocators in the supply chain who bought small certified monopolies and priced them: Nicholas Howley's TransDigm returned 26.9 times from its first close on March 15, 2006 to April 30, 2018, 31.2% a year against 8.3% for the S&P 500 total return, and at HEICO $100 invested on October 31, 1990 became $128,481.31 by October 31, 2025 on the company's own table. Boeing is the counterexample. It returned $64.3bn to shareholders from 2013 to 2019, 133% of its $48.4bn of free cash flow, and its stock returned 26.3% a year from the end of 2012 to the end of 2019 and then lost 7.0% a year to the September 2026 snapshot, a 39% loss while the S&P 500 total return rose 2.6-fold.
The report finds that every variable behind that gap was observable in advance in free public documents, and this primer is a working manual for reading them. This is one of a weekly series of primers whose purpose is to help readers expand or deepen a circle of competence, one industry at a time.
The companion deck. Aerospace: a self-contained summary of the report in slide form.

What's inside
The primer has two parts, both attached to this post: a 249-page report and a companion deck that can be read on its own. The report has eight parts, twenty-seven chapters, and four appendices, with 30 exhibits, 20 tables, and three photographs; every figure is dated and sourced in the notes. The highlights, part by part:
Part I, Orientation. Why the industry repays the time, the chain reduced to three businesses with one FY2025 worked example each, and the map that certification rather than geography drew. At the September 18, 2026 close the forty companies featured in the primer were worth about $2.34tn, and they sort by how much of the flying fleet's consumption each owns: the six engine companies were worth about $941bn and the seven listed airframers about $499bn. Chapter 3 draws the ten working segments of the chain, from the airframe to the forging and the maintenance shop, and explains why their revenues cannot be added: they supply one another. The borders are drawn by certification, since the holder of a type certificate, the regulator's approval of a design, controls that design for the life of the fleet, and the lessors own just over half of the commercial fleet by industry estimates.
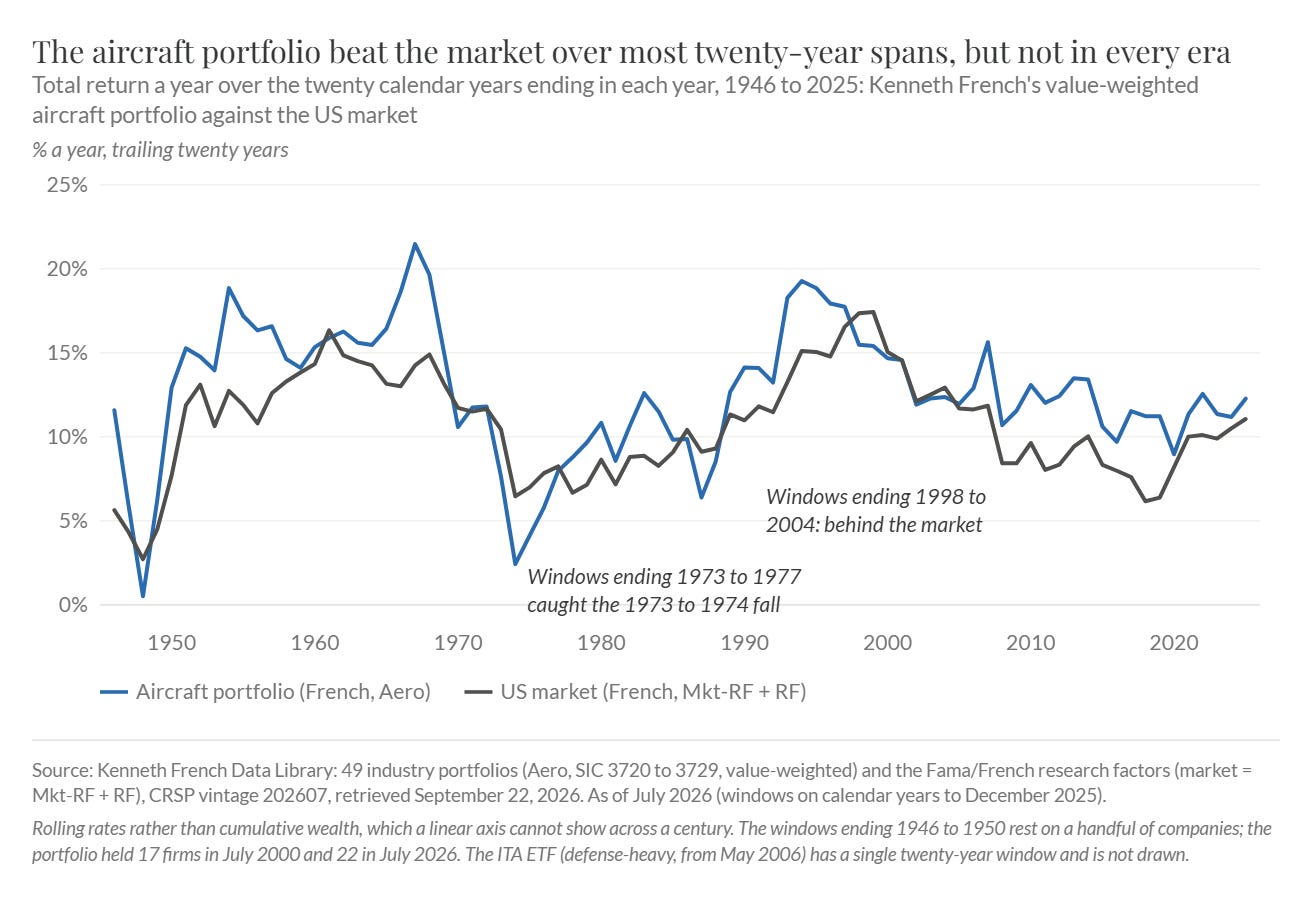
From Chapter 1: the total return a year of Kenneth French's value-weighted aircraft portfolio and of the market over the twenty calendar years ending in each year from 1946 to 2025. The portfolio beat the market in 63 of 80 rolling twenty-year windows, though not in every era.
Part II, Evolution. A century and a quarter told as the making of a duopoly, an engine trio and a supply chain that earns more than the names it supplies. The structure was set before the jet: the Air Commerce Act of May 20, 1926 made the government the licensor of every airworthy design, and the Air Mail Act of June 12, 1934 separated the airframer from its engine maker and its customer, which is why the engine and systems makers supply every airframer.
The jet age turned a crowded industry into a duopoly because each generation of airplane cost more than the last and the losers could not fund the next. Pan Am's order of April 13, 1966 for twenty-five 747s launched a program that took Boeing's payroll down to 38,690 in April 1971, and Rolls-Royce went into receivership on February 4, 1971 on a fixed-price engine costing £110,000 more than its price. The engine makers drew the lesson and shared each program's risk with partners, and the three Western makers of large turbofans of 1970 are the three of 2026. Airbus Industrie, established on December 18, 1970, booked one order in 1976 before Eastern Air Lines' order of April 1978 broke the incumbents' hold, and McDonnell Douglas merged into Boeing on August 1, 1997.
In the century's first quarter Boeing lost its parity with Airbus through a loss of engineering control, from the 787, launched on April 26, 2004 and first delivered on September 25, 2011, to the 737 MAX, grounded from March 13, 2019 to November 18, 2020, and the door plug of January 5, 2024, after which the FAA froze 737 output at the rate then flowing, about 38 a month. The top of the chain is now buying back its constrained suppliers: Spirit AeroSystems on December 8, 2025 and, agreed on September 8, 2026, the castings maker Consolidated Precision Products for $11.75bn. Chapter 8 tells four cases as the decisions their institutions took: TransDigm as the industry's way to compound, and Rolls-Royce's fixed price, Boeing's loss of engineering control and the CSeries of Bombardier (TSX: BBD.B), a good airplane its maker could not fund, as three ways to fail.
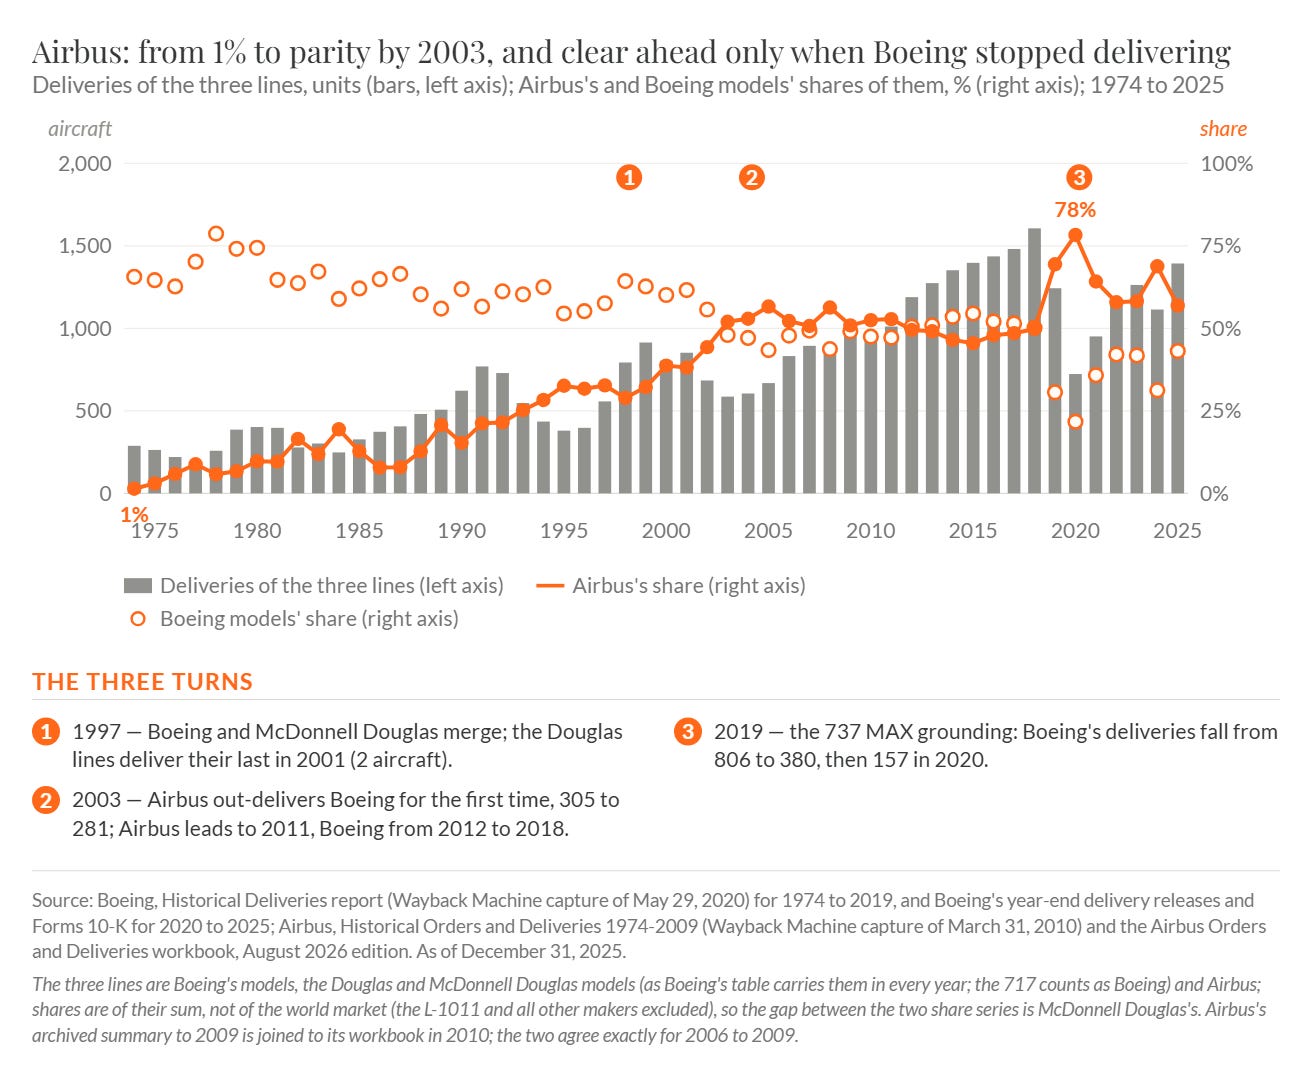
From Chapter 7: deliveries of large jets each year from 1974 to 2025, with Airbus's and Boeing's shares of them. Airbus rose from 1% to parity by 2003, the two makers split 17,140 deliveries almost exactly from 2003 to 2018, and Boeing's share has been between 22% and 43% in every year since 2019.
Part III, Structure & Economics. Where the profit pools, how the cycle works, and what each position in the chain, which the report calls a station, earns. The profit goes to whoever owns certified content that the fleet consumes, and three contractual facts decide the split: who buys the part (the airframer once, or the operator one unit at a time), whether the position is sole-source for the life of the aircraft type, and how much aftermarket content the part carries.
World traffic, measured in revenue passenger kilometers, rose from 460bn in 1970 to 8,664bn in 2019, 6.2% a year, fell 65.9% in 2020 and first exceeded 2019 only in 2024. Orders swing far more than deliveries, from a combined book-to-bill (orders over deliveries) of 0.42 in 2009 to 3.08 in 2005 and 2007, and a 2006 to 2025 book-to-bill of 1.45 built the backlog that absorbs each shock, about 16,100 large jets at the two makers at August 31, 2026, 11.6 years of 2025's deliveries. The unit-economics chapter shows that every clean-sheet airliner launched after the 777 that has delivered was late, by one and a half to three and a half years, or never delivered, and that the engine model can also produce large losses: the geared turbofan's recall cost RTX Corporation (NYSE: RTX) a $2.9bn charge for Pratt & Whitney's 51% share.
On one definition from FY2015 to FY2025 the proprietary owners' returns on invested capital never fell below 11%, while Spirit went from 29.4% in 2015 to an after-tax operating loss of 77.6% of its invested capital in 2024. The airframers' moat protects them only from entrants, since COMAC took fourteen years from its founding to a first C919 delivery and still flies on a Western engine. The check on a sole-source price is the Parts Manufacturer Approval, a certified copy sold below the original maker's price, on which HEICO's Flight Support Group built $3,117.3m of net sales at a 24.1% margin in its 2025 fiscal year.
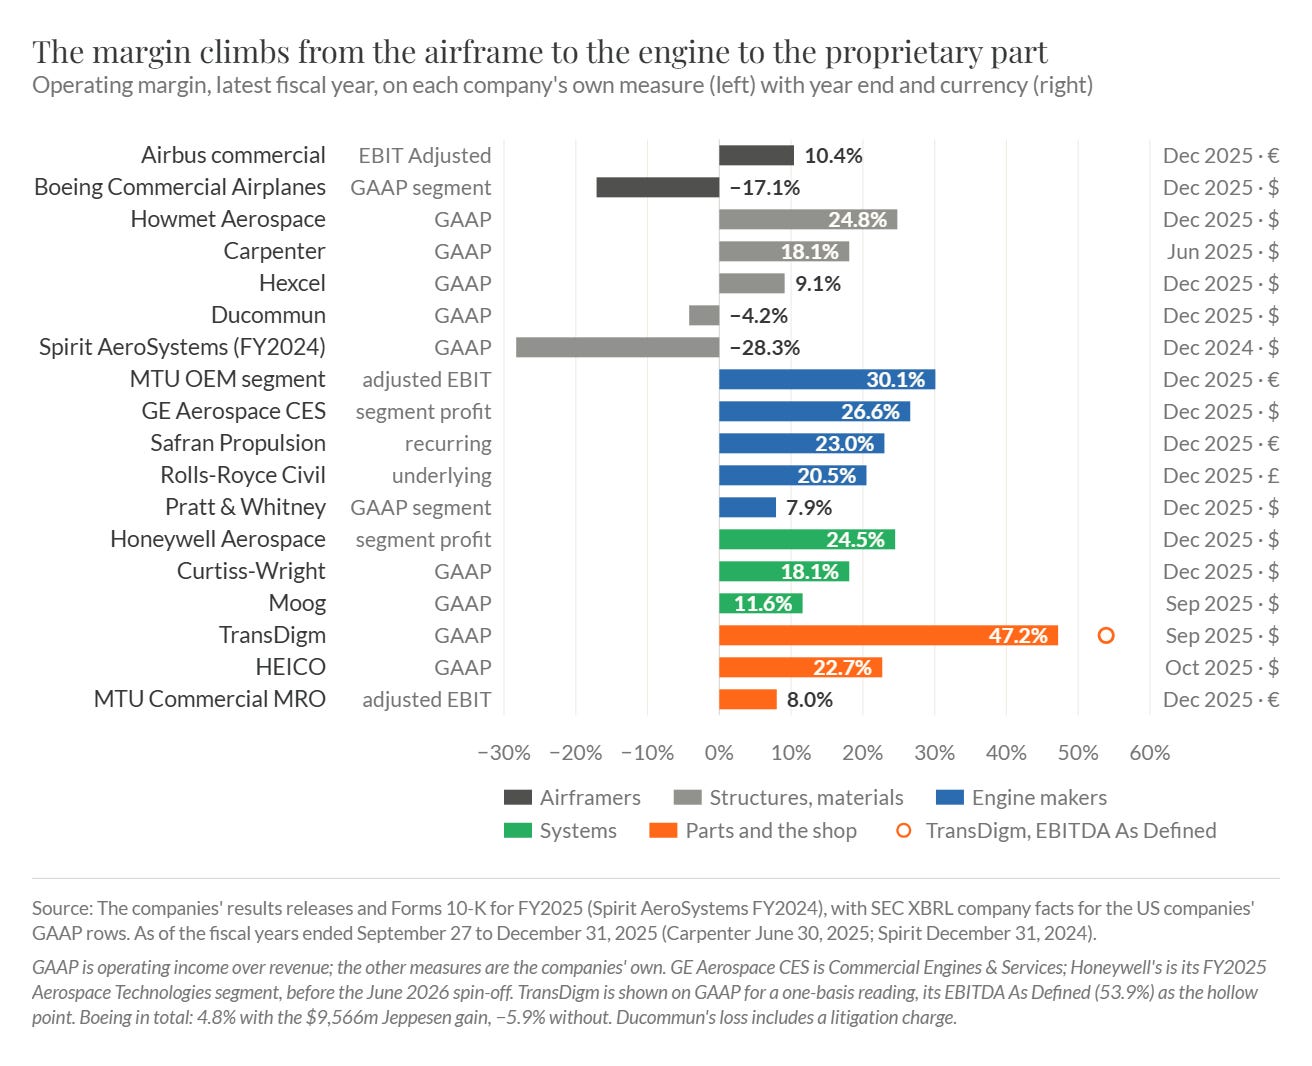
From Chapter 9: each company's operating margin in its latest fiscal year on its own measure, colored by station. The ladder runs from a 17.1% loss at Boeing Commercial Airplanes and 10.4% at Airbus's commercial business to 47.2% on GAAP operating income at TransDigm.
Part IV, The Players. The forty featured companies on one page at one date, two chapters on the owner-operators and the allocators, and the forces that set the chain's terms without a share price. Airbus and Boeing hold the same position and use it very differently. On €73.4bn of 2025 revenue Airbus earned €7,128m of EBIT Adjusted, 9.7%, and ended the year with €12.2bn of net cash; Boeing's $4,281m of GAAP earnings from operations included a $9,566m gain on the sale of Jeppesen and its sister businesses, so the year was an operating loss of about $5.3bn without it, with free cash flow of minus $1,877m and net debt of about $24.7bn. The same pattern shows inside the conglomerates: within RTX, Pratt & Whitney's margin was 7.9% and Collins's 16.3%.
The owner-operator chapters put every record on one basis, total shareholder return with dividends reinvested over each tenure, against the S&P 500 total return and French's portfolio over the same dates, with the window printed. Precision Castparts under Mark Donegan returned 12.24 times from March 31, 2002 to March 29, 2015, 21.3% a year, with earnings per share up 15.8-fold and no help from the multiple, before Berkshire Hathaway (NYSE: BRK.A, BRK.B) paid $235 a share in cash, completed January 29, 2016.
John Plant's Howmet has returned 41.6% a year since February 2019, and at the snapshot it traded at 40.3 times FY2025 EBITDA against 5.8 times in 2018, so part of that rate is a re-rating no downturn has yet tested. TransDigm's twelve special dividends came to $394.50 a share. The chapter on the unlisted forces covers the French and German states, which each held 10.8% of Airbus at March 31, 2025, the launch-aid dispute at the World Trade Organization and Precision Castparts inside Berkshire, which reported $10.8bn of revenue in 2025, more than Howmet's $8.3bn.
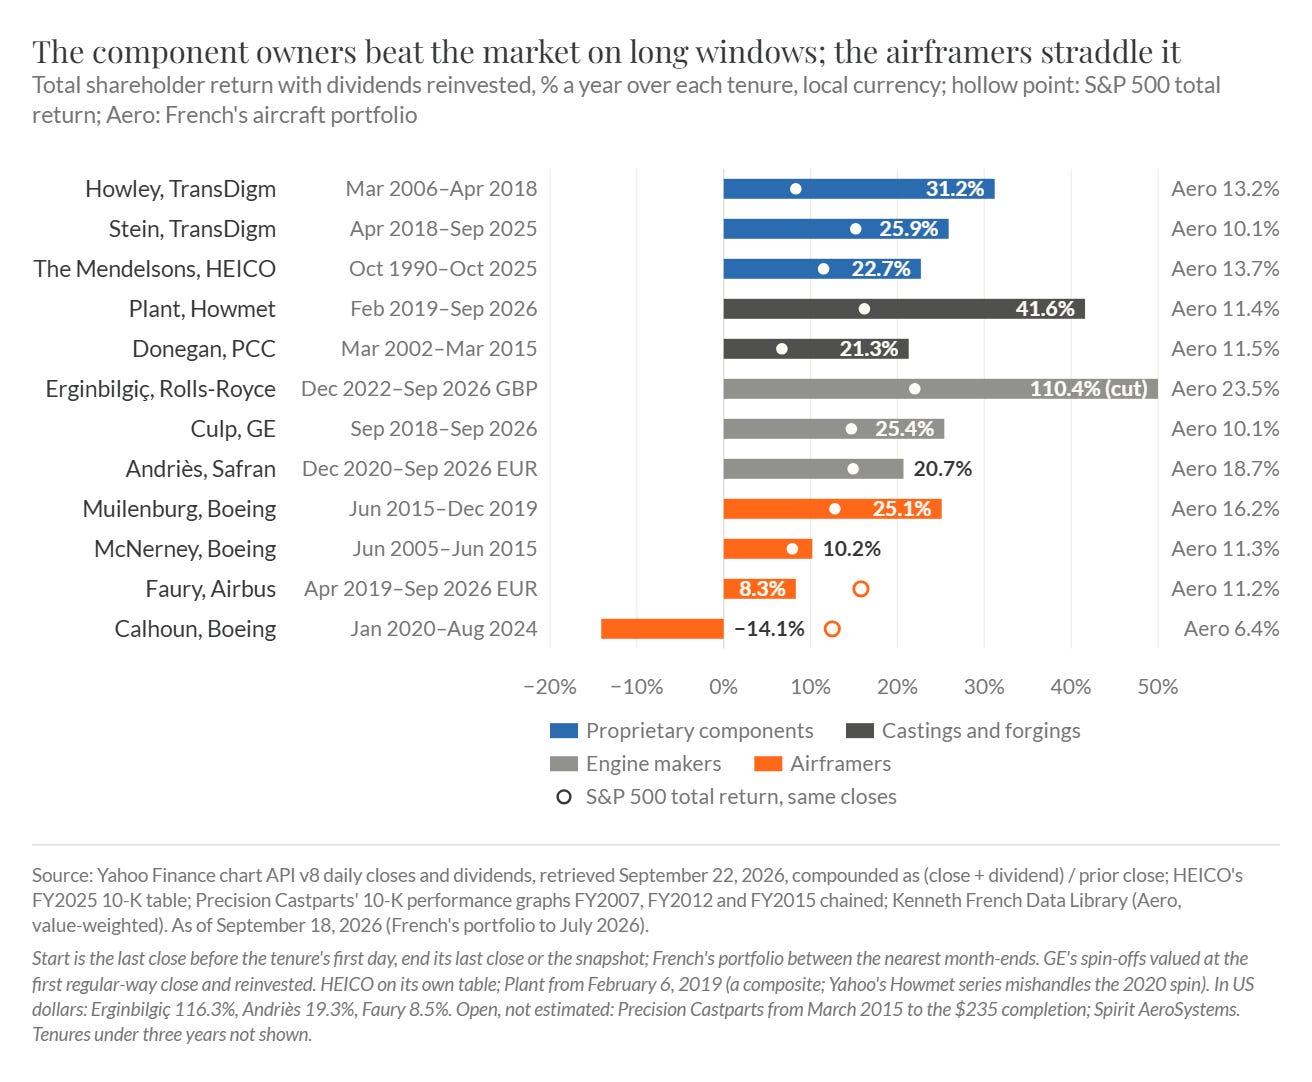
From Chapter 16: total shareholder return with dividends reinvested over each leader's tenure, in local currency, against the S&P 500 total return and French's aircraft portfolio over the same dates. Howley's TransDigm returned 31.2% a year from March 2006 to April 2018 against 8.3% for the S&P 500 total return.
Part V, Speaking the Language. Part V is the reference section: the vocabulary and the benchmark ranges, the places in the accounts where the estimates live, and a tour of the filings in the order the questions arise. Most arguments about an aerospace company are arguments about a definition, and the filing names the one in use: the margin's label (Airbus's EBIT Adjusted, Safran's recurring operating income, Rolls-Royce's underlying operating profit, TransDigm's EBITDA As Defined), the free-cash-flow definition, the aftermarket's perimeter and, for Boeing, which of three backlogs. Boeing's release put Commercial Airplanes at "over 6,200 airplanes valued at a record $597 billion" at June 30, 2026 on the ASC 606 basis, while press summaries of its orders-and-deliveries site counted about 6,750 unfilled orders at August 31, 2026.
Program accounting, under which Boeing spreads the cost of a program over the units it expects to deliver, is still in use for commercial airplanes, and two of the three critical audit matters in the FY2025 10-K are program-accounting estimates. The engine makers' estimates live in their long-term service agreements: Rolls-Royce's 2017 operating profit was £1,175m under the old standard and £321m under IFRS 15, with no change to cash. The 737 MAX crisis cost $14,586m in disclosed pre-tax charges in the 10-Ks, before the SEC's $200m penalty and about $6.3bn of higher costs absorbed into the program margin. Cash flow is the test of those estimates: Boeing burned $37.9bn of free cash flow from 2019 to 2025 as diluted shares rose from 565m to 762m, while in 2025 Rolls-Royce's free cash flow was 94% of its underlying operating profit and Airbus's, before customer financing, 64% of its EBIT Adjusted.
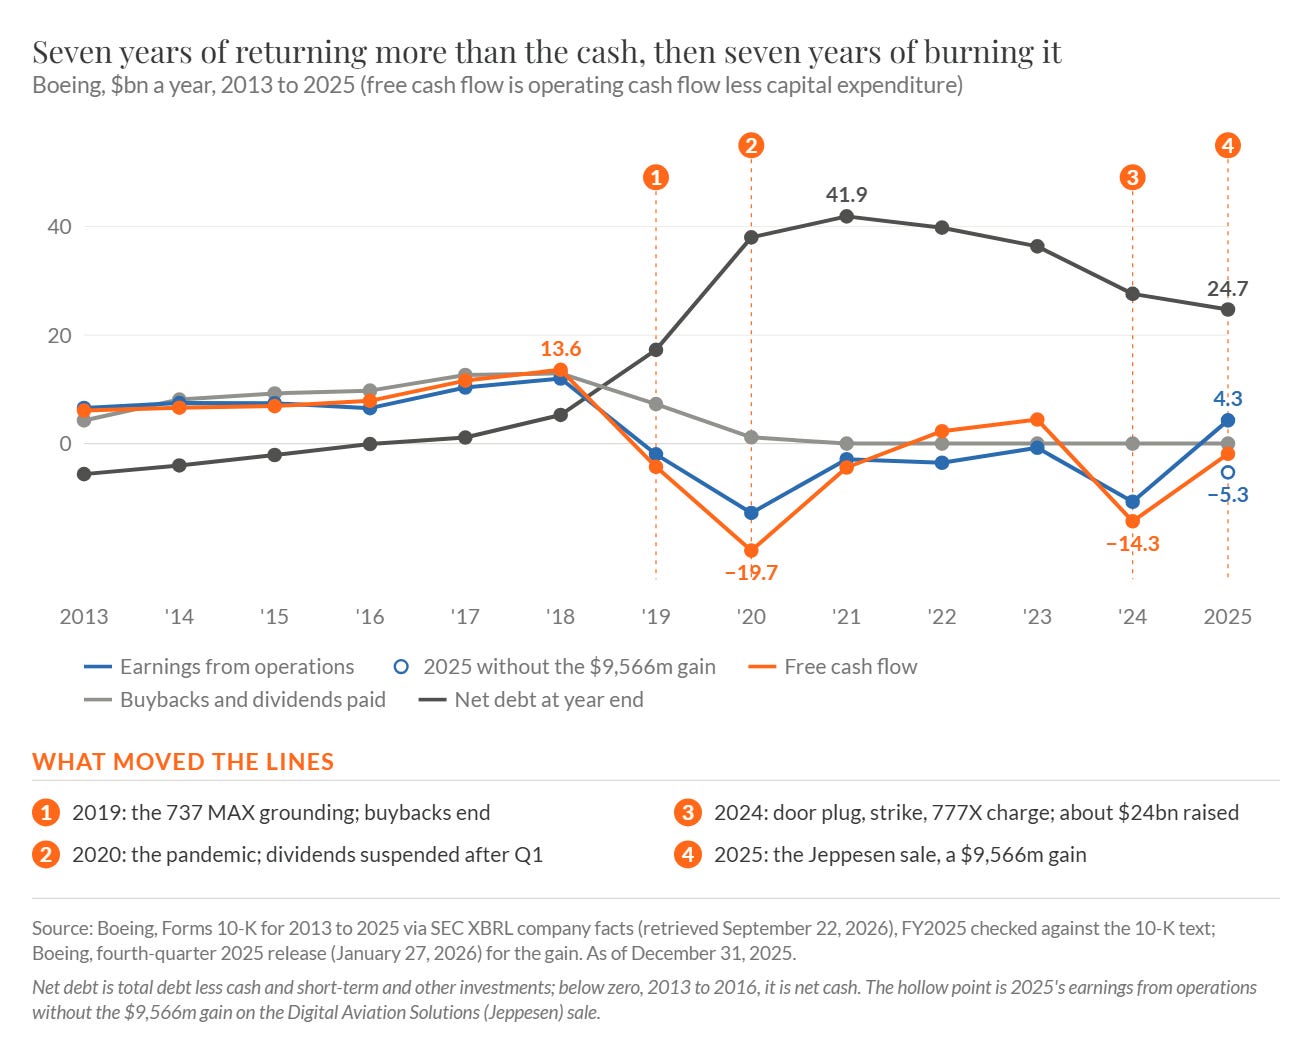
From Chapter 19: Boeing's earnings from operations, free cash flow, buybacks and dividends, and net debt, in $bn a year from 2013 to 2025, with the grounding, the pandemic, the door plug and the Jeppesen sale marked. Free cash flow of $13.6bn in 2018 became an outflow of $19.7bn in 2020, and net debt stood at $24.7bn at the end of 2025.
Part VI, Analysis & Valuation. The sequence a practitioner runs and what the record says it is worth. An aerospace company is analyzed from the installed base upward: the station and the sole-source content first, then the fleet that carries them and the aftermarket's growth against its flying, then the programs, and only then the margin, with leverage read as a statement about the steadiness of the aftermarket cash.
At the September 18, 2026 close the featured set traded at a median of about 20 times FY2025 EBITDA, from 14.0 times for the airframers to 29.1 for the proprietary-component makers, while the free-cash-flow yield ran the other way, from 5.1% to 2.1%. The aftermarket premium is real but weak: across sixteen companies the fitted line is EV/EBITDA = 17.1 + 0.107 × share, with an r-squared of 0.10, because the market pays for proprietary aftermarket margin and scarce capacity rather than aftermarket revenue, and it pays about as much for a US listing, a median of 25.6 times against 13.9 for companies listed elsewhere. Strategic buyers paid 12.7 to 17.4 times trailing EBITDA from 2011 to 2025, and GE Aerospace's price for CPP, about 26 times 2027 EBITDA before synergies, is well above that range.
The base-rates chapter decomposes the returns: across thirty-six listed companies over the twenty years to the snapshot the median returned about 11.6% a year and the spread was 23.6 points, with the proprietary-component makers from 16.5% to 27.1% and the airframers at a median of 6.5%. The suppliers compounded on growth, with revenue adding 13.3 points a year to HEICO's return from FY2009 to FY2025, while 15.4 points of Howmet's 48.7% a year since FY2020 came from the multiple.
Part VII, The AI Inflection. Aerospace has been computational for half a century, so the part counts only claims with a number, a date and a base. In the featured set's FY2025 annual filings artificial intelligence is a risk factor, not a business line: across 27 filings the median uses the phrase once, against about 44 uses of "cyber," and Curtiss-Wright (NYSE: CW) writes that it does not currently use AI in the design and development of its products.
Three deployments carry a dated company figure: GE Aerospace's blade inspection, extended to more than a dozen LEAP engine shops on February 13, 2025; GE's internal AI Wingmate tool at 52,000 employees; and Airbus's Skywise data platform at "over 12,000 connected aircraft" on April 1, 2026. Certification keeps machine learning off flight-critical functions until about the end of the decade. The risk that matters is the fight over the fleet's data: the IATA principles giving the airline its data were signed on October 2, 2024 by Airbus, Embraer (NYSE: EMBJ) and Rolls-Royce only. The largest effect so far has come through power demand for data centers, which pulls on the same foundries: Howmet's Gas Turbines revenue rose 25.0% to $944m in 2025 and 38% in the second quarter of 2026.
Part VIII, Risks & Debates. Nearly every aerospace failure in the record is a program bet larger than the balance sheet, a loss of engineering control, or leverage carried into a traffic shock, and each shows first in the inventory, the customer advances, the regulator's letters and the production rate before it reaches the income statement. Most of those indicators have a live reading in 2026: Airbus needed about 99 deliveries a month from September to December to reach around 870 for the year, against about 59 a month through August, and Honeywell Aerospace (NASDAQ: HONA) cut its organic growth guidance to 4% to 5% on August 5.
Eleven debates follow, each with the facts first, the proponents named and quoted, and the number that would settle it. In the first half of 2026 the engine and parts makers grew by a fifth to a quarter while both airframers consumed cash, Boeing's free cash flow at minus $823m. The aftermarket's growth meets its first dated forecast of a slowdown in Melius Research's downgrade of September 14, 2026; the engine model is questioned from inside, by RTX's Chris Calio on July 23, 2026; and the price of buying suppliers is an open question, with GE Aerospace paying about 26 times forward EBITDA for CPP, twice Berkshire's 12.7 times trailing for Precision Castparts.
The appendices. The investable universe, 82 listed companies along the chain grouped by station and region with their listings, the forty featured companies marked, and the unlisted forces an investor must still understand set out beside them; a twenty-six-question due-diligence checklist in eight sections, in the order of the analytical procedure of Chapter 21, with the place to look named for every question; a reading course of the companies' letters, proxies and investor days, the accident and regulatory reports, books, outlooks, hearings and calls, and data sources; and the numbered notes that source the report.
The companion deck. The report in the format of the Monday Morning Briefing, designed to be read without the report: the eight propositions of the Executive Summary with the number that carries each, every exhibit re-rendered for the slide format under a title that states its lesson, the three businesses in FY2025 numbers, the history in three eras, the tables that carry the argument from the business models by station to the multiples by station and the calendar of the debates, and slides on the four cases, the moats, the unlisted forces, the analytical procedure and the failure modes, material that has no exhibit in the report, followed by the universe, the checklist and the summary corrected for survivorship bias.
What the primer is for. A reader who works through it should be able to explain how aerospace makes money, and why the airframe, the engine and the proprietary part are paid at different points in an aircraft's life; use the industry's vocabulary, from the type certificate, the shop visit and the Parts Manufacturer Approval to the accounting quantity of program accounting and TransDigm's EBITDA As Defined; read the filings without being misled by an air-show order tally taken for a firm order, a backlog quoted on the wrong basis or earnings that rest on program-accounting estimates; appraise a company the way specialists do, from the installed base upward in the sequence of Chapter 21 and against the multiples by station and the prices strategic buyers have paid; and recognize the managers and business models that have compounded value over decades, and the ones that returned more cash than they earned.
How to use this primer
The report does not need to be read in order. Suggested paths:
a generalist with limited time, Parts I and VI plus the checklist in Appendix B;
a reader interested in the history, Part II;
an accountant, Part V with Chapter 11;
an analyst working on a specific company, Chapter 14, then Parts III, V, and VI in order;
a risk officer, Part VIII with Chapter 8;
a technologist, Part VII;
a reader who came for the owner-operators, Chapters 15 and 16, with Chapter 23 for what their records are worth against the index.
Every chapter ends with a "What to remember" box, and the twenty-seven boxes read in sequence summarize the report. The checklist follows the order of the analytical procedure in Chapter 21, and its five questions on the installed base and the company's position come first, because in this industry the money is made on the installed base rather than on the delivery.
Feedback and requests
Please reply to this email or leave a comment with what was useful, what was missing, any errors you find, and the industries you would like covered next. Member requests will inform the order of coverage.
This content is published by MOI Global for educational purposes only. It is not investment advice, an offer, or a solicitation, and no security mentioned herein is recommended for purchase or sale. The publisher and contributors may hold positions in securities discussed. Figures are believed accurate as of the dates stated but are not warranted; readers should verify all data against primary sources before relying on it. Nothing herein constitutes legal, tax, or accounting advice.