

We are delighted to share with you the second in-depth research report in our Industry Primers series, this one on property and casualty insurance and reinsurance. The series exists to help fundamental, long-term investors expand and deepen their circle of competence, one industry at a time, and your feedback on what was useful and on which industries to cover next shapes what we produce. The report is complemented by two podcast episodes, the first telling the story of the industry and the second digging deeper into the fundamentals from an investor’s standpoint. Below, you will find two PDF files for download: the research report (members only) and the accompanying slide deck (free to access). We start with a quick anecdote:
On December 6, 1951, The Commercial and Financial Chronicle printed a one-page article headed “The Security I Like Best” by a twenty-one-year-old from Omaha. The security was Government Employees Insurance Company, and the argument was an expense ratio. GEICO’s underwriting profit was 27.5% of premiums earned in 1949, against 6.7% for the 135 stock casualty and surety companies in the Best’s compilation, because GEICO sold direct and had no agents and no branch offices. Seventy-five years later GEICO is part of Berkshire Hathaway (NYSE: BRK.B), and the gap is still there. In fiscal 2025 GEICO ran an 84.7% combined ratio on a 12.4% expense ratio, against a statutory combined ratio of 92.2 for the US industry.
The report describes an insurer as a leveraged investment vehicle whose leverage is priced by underwriting. An insurer collects premiums before it pays claims, and it invests the money in between, which the industry calls float, for its shareholders. Berkshire held about $176bn of float at December 31, 2025 at a cost of minus 5.45% a year: it earned $9,460m of pre-tax underwriting profit on an average float of $173.5bn, so it was paid to hold the money. The combined ratio, losses plus expenses as a share of premium, sets the price of that leverage. At a combined ratio below 100 the insurer earns an underwriting profit and holds its float for less than nothing; above 100 it pays for the float out of investment income. Return on equity is the underwriting margin times premium leverage plus the investment yield times asset leverage, less tax. Progressive (NYSE: PGR) earned 35.3% on average common equity in fiscal 2025 from a 12.6% underwriting margin at 2.92 times premium leverage. RenaissanceRe (NYSE: RNR) earned 25.9% from a nearly identical margin at 0.96 times, because its return comes from the investment side.
The report starts from the long-run record. Nineteen listed insurers and reinsurers that survived to be ranked returned a median 11.84% a year with dividends reinvested, against a median 10.86% for the S&P 500 over the same windows, and fourteen of the nineteen beat the index. The spread is wide. Kinsale Capital (NYSE: KNSL) compounded at 35.18% a year from its July 2016 listing against 15.19% for the index, while AIG (NYSE: AIG) returned minus 1.83% a year over 33.6 years. Those are the returns of survivors: of roughly twenty companies formed in the Bermuda reinsurance classes of 1993, 2001, and 2005, four were still independently listed on September 4, 2026. The primer’s larger claim is that a reader can understand this industry from public documents, because the accounting is published, every United States filing must carry a ten-year loss-development table by line of business, and the base rates run for forty years. This is one of a weekly series of primers whose purpose is to help readers expand or deepen a circle of competence, one industry at a time.
The companion deck. Property and Casualty Insurance & Reinsurance: a self-contained summary of the report in slide form.

What’s inside
The primer has two parts, both attached at the end of this post: a 267-page report and a 53-slide companion deck that can be read on its own. The report has eight parts, twenty-seven chapters, and four appendices, with 26 exhibits, 22 tables, and three photographs; every figure is dated and sourced in the notes. The highlights, part by part:
Part I, Orientation. Why the industry is worth studying, how an insurer makes money, and a map of the industry. The United States industry wrote about $1.1tn of direct premiums in 2024 against policyholders’ surplus of $1,131.6bn; $800bn of global reinsurer capital stood behind the world’s carriers at June 30, 2026; and the largest American writer, State Farm, has no shares, with $93.8bn of direct premium in 2023, or 9.9% of the market. The listed universe is about forty-four investable majors. Berkshire alone is roughly 38% of their market value, and without Berkshire, Europe rather than the United States is the largest bloc. Chapter 2 sets out float, the combined ratio, and the return decomposition on one page, and it shows why a combined ratio means nothing without its basis: Progressive reported 87.4% for 2025 under GAAP, 87.1% on the statutory basis, and 89.1% for the 2025 accident year, and all three are correct.
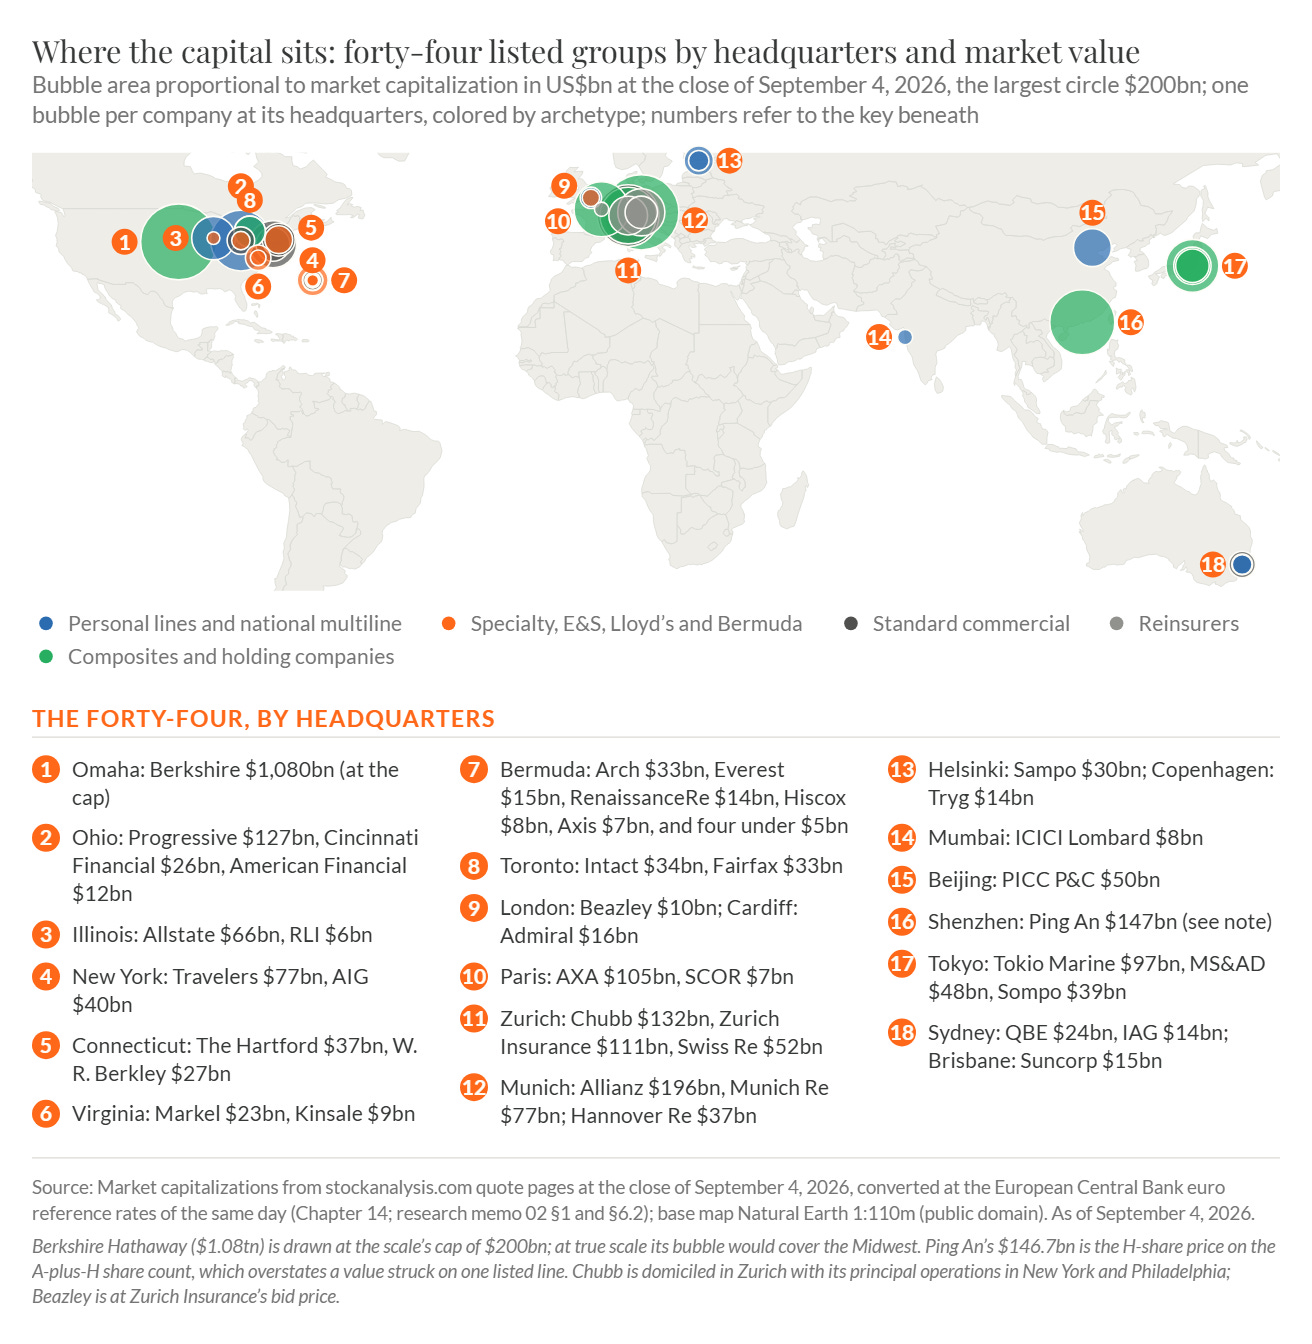
From Chapter 3: the forty-four listed groups as bubbles at their headquarters, sized by market capitalization at the close of September 4, 2026, with a numbered key. Berkshire Hathaway, at $1.08tn, is drawn at the scale’s cap of $200bn; at true scale its bubble would cover the Midwest.
Part II, Evolution. The history of the industry from the coffee house to the January 2023 renewals, told as one event repeated: a correlated loss arrives, carriers find they have written more exposure than they knew, some pay in full and some do not, and capital is destroyed and then returns at a higher price. Chicago in 1871 broke 68 of the 182 companies carrying its risks, and only 31 paid in full. San Francisco in 1906 produced insured losses of $235m in dollars of the day, bankrupted at least twelve American insurers, and wiped out the industry’s profit of the preceding forty-seven years; Munich Re (Xetra: MUV2) paid its 11 million marks in full. The professional reinsurer was the answer to correlated fire loss: Cologne Re in 1846, Swiss Re (SIX: SREN) in 1863, Munich Re in 1880. The century that followed turned a property business into a liability business. The era of catastrophe capital opened with Hurricane Andrew on August 24, 1992, after which eleven insurers became insolvent. Each large catastrophe then brought a new class of Bermuda reinsurers: about $695m of capital raised in 1985 and 1986, $4.8bn in 1993, $8.5bn in 2001, and $13.3bn in 2005. Four case studies close the part: GEICO’s near-failure in 1976, Progressive’s published 4% underwriting-profit objective, AIG’s three simultaneous failures in 2008, and the twenty-one years Lloyd’s took to move from the first loss of its reinsurance spiral in 1988 to legal finality in 2009.
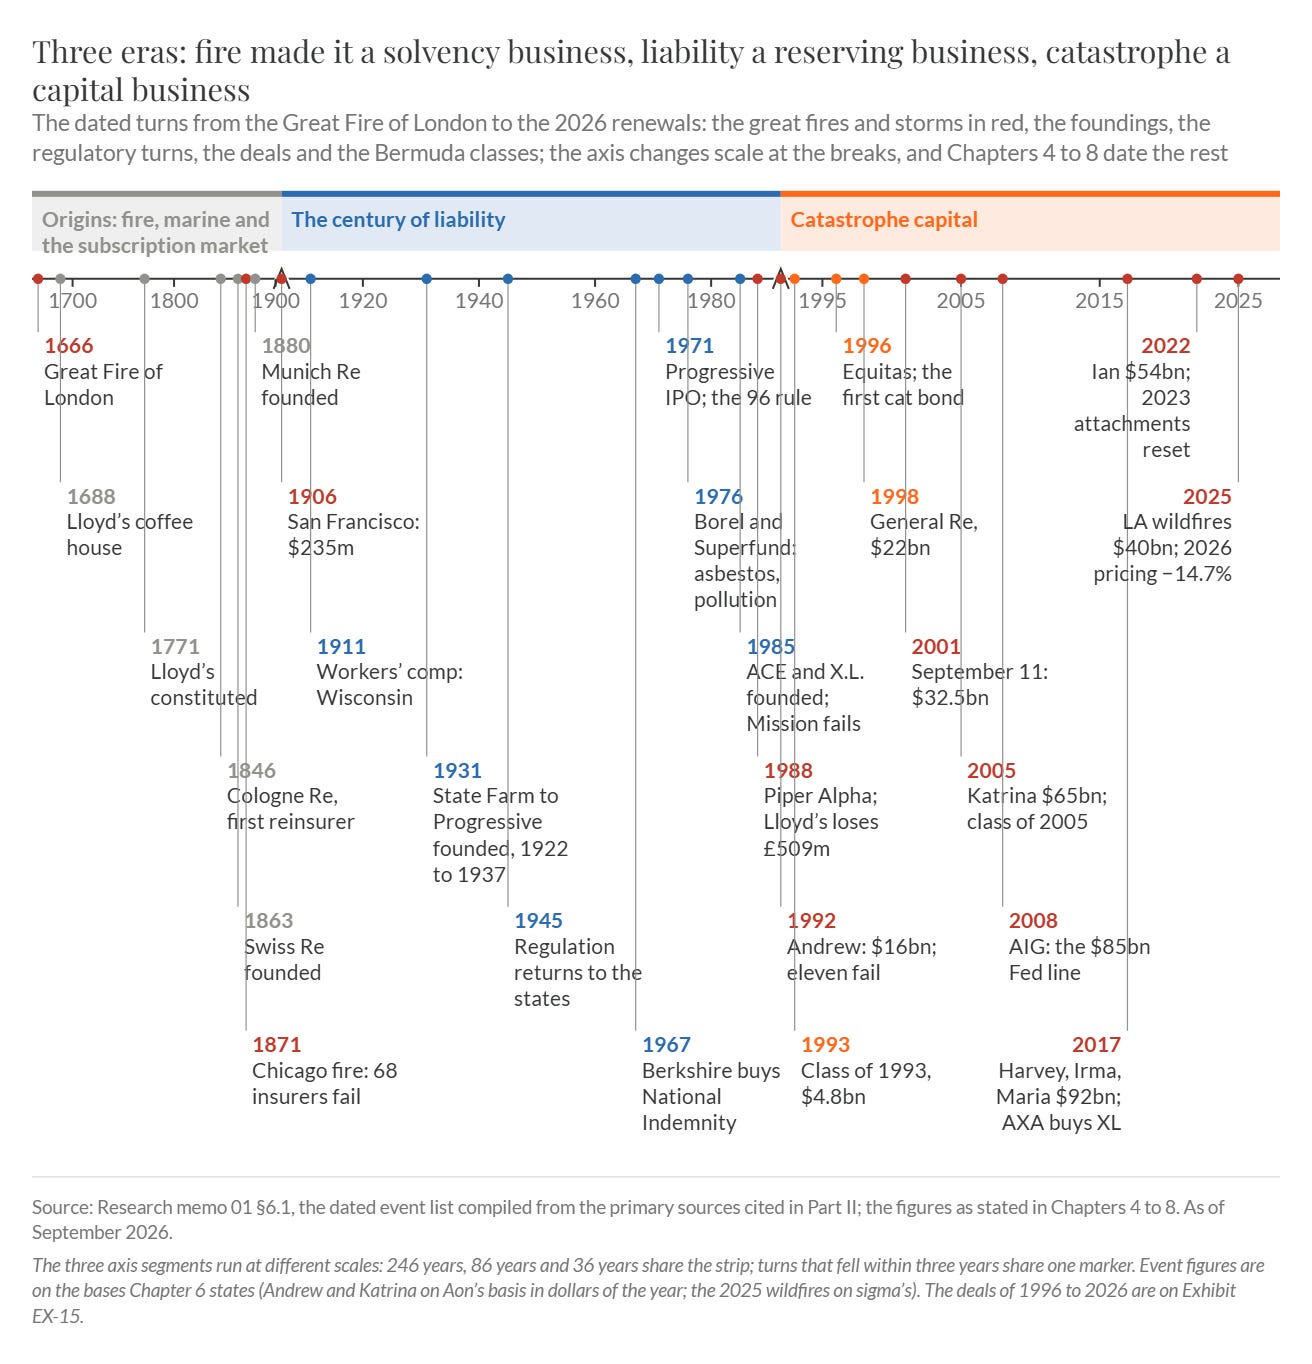
From Chapter 4: the dated turns from the Great Fire of London in 1666 to the 2026 renewals, on an axis that changes scale at 1906 and at 1992. The great fires and storms are in red; the foundings, the regulatory turns, the deals, and the Bermuda classes are in the era colors.
Part III, Structure & Economics. This part follows the premium dollar through the industry and shows who keeps what. A premium passes through as many as seven hands, from the retail agent to the reinsurer and the capital markets, and every intermediary gets paid whether the business is profitable or not, while the risk-takers do not. The US industry paid 10.8 points of net written premium in commissions and brokerage in 2023 and ran a 24.9% expense ratio, but the average hides a dispersion of models: GEICO ran a 12.4% expense ratio in fiscal 2025 and The Hartford’s commercial book ran 31.2%. The cycle chapter dates twenty years of the industry’s combined ratio to the losses that turned it. Calendar 2025 was the best US underwriting year in a decade, a statutory combined ratio of 92.2 against 101.9 in 2023, earned while premiums were falling. The unit-economics chapter builds float, the combined ratio, and investment leverage into a return on equity for four types of company. The moats chapter tests each candidate advantage against the record and keeps four: a distribution cost advantage, pricing sophistication where the feedback loop is short, underwriting culture and specialization, and capital and ratings as a license to write.
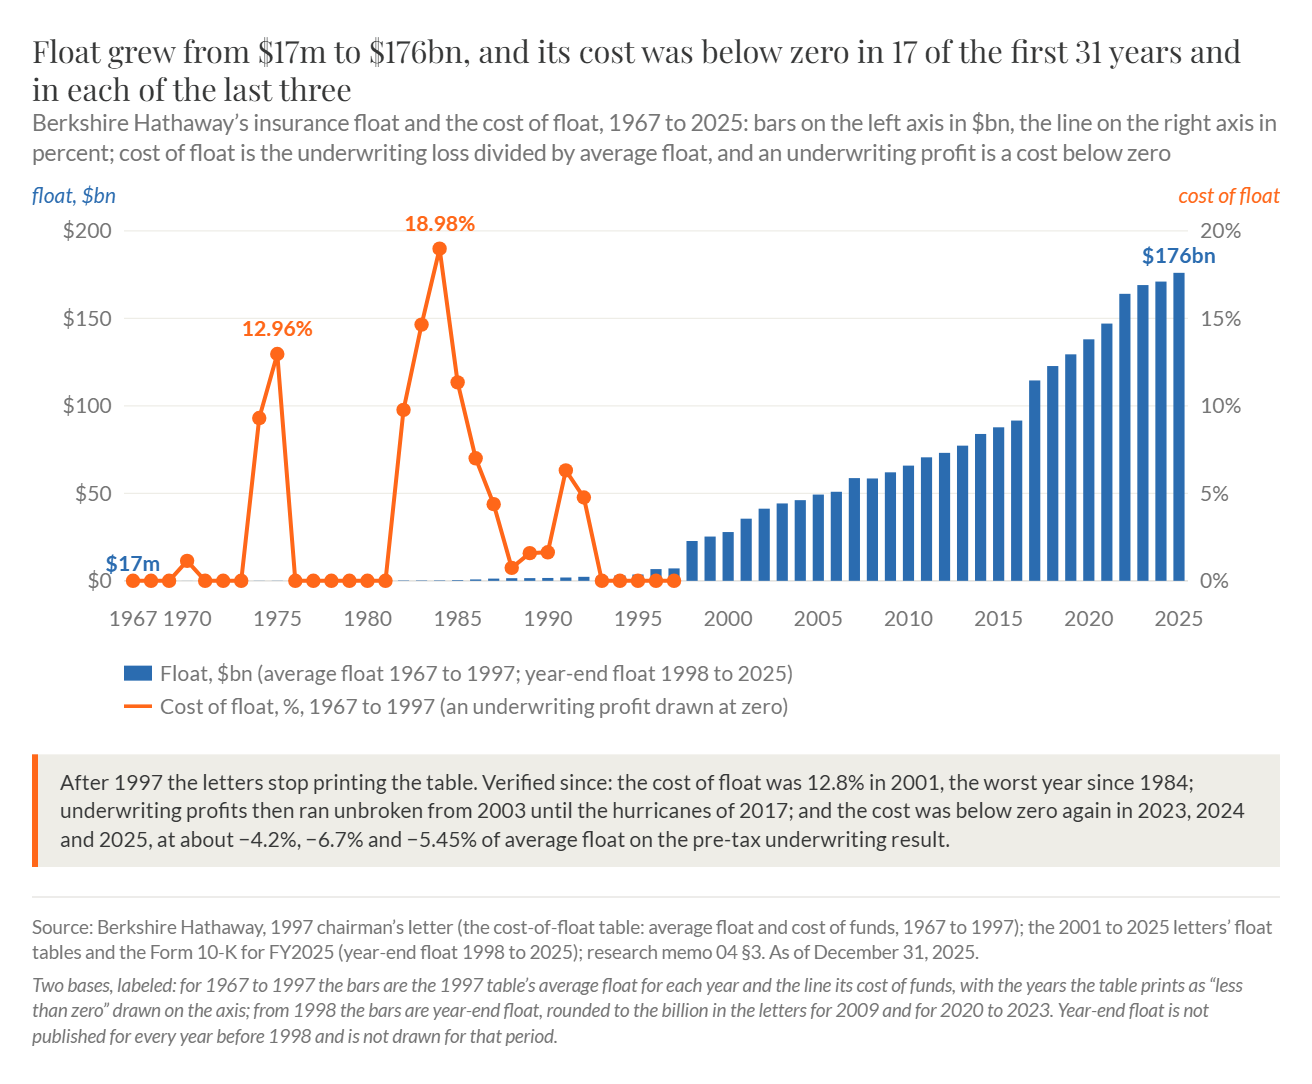
From Chapter 11: Berkshire Hathaway’s insurance float on the left axis, from $17m in 1967 to $176bn in 2025, and the cost of float on the right axis. The cost was below zero in 17 of the first 31 years and in each of the last three; in 1984 it reached 18.98%.
Part IV, The Players. Profiles of the forty-four listed majors, each with its market value, its combined ratio on the basis the company reports, and its price to book. No two of the three accounting regimes in use produce comparable combined ratios, so every figure in the table carries its basis. Two chapters go to the owner-operators and the master allocators, from Warren Buffett and Ajit Jain to Peter Lewis at Progressive, Hank Greenberg at AIG, Prem Watsa at Fairfax Financial (TSX: FFH), and Michael Kehoe at Kinsale: their records, the incentive plans in their proxy statements, which in this industry pay on book value per share, and their letters. Three of ten owner-operators beat the index on book value per share plus dividends over the decade to 2025; the long tenures beat it and the last decade did not. A chapter on the unlisted forces covers the mutuals, the state, and private capital. State Farm began paying a $5bn cash-back dividend on more than 49 million vehicles on July 31, 2026. Florida’s Citizens fell from 1,407,805 policies in September 2023 to 266,093 in August 2026. Third-party reinsurance capital stood at $144.5bn at June 30, 2026.
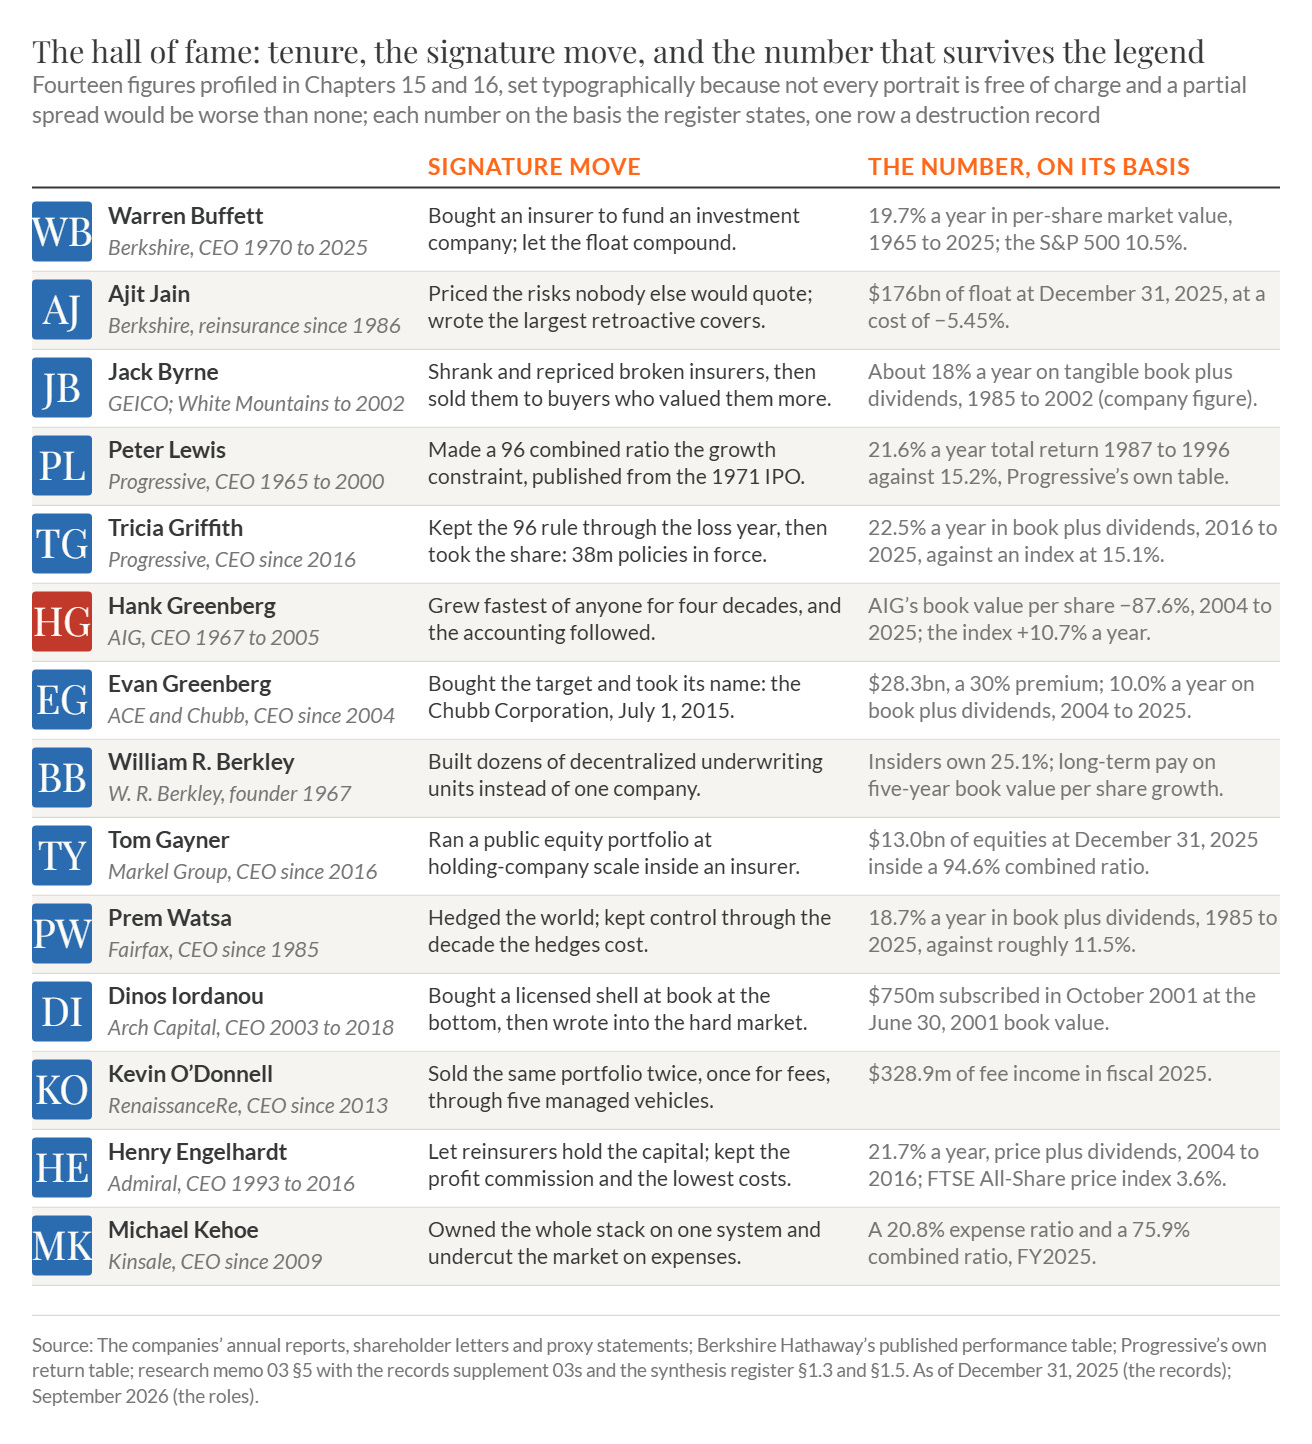
From Chapters 15 and 16: fourteen owner-operators and allocators, each with the move that defined the tenure and one number on the basis the report states. Warren Buffett’s 19.7% a year in per-share market value from 1965 to 2025 heads the list; one row is a record of destruction.
Part V, Speaking the Language. Part V is the reference section. Every figure in this industry carries seven descriptors, from the premium base and the accounting regime to the fiscal year and the currency, and a figure without them cannot be compared. A glossary and a guide to the key performance indicators separate the metrics managements report from the ones the reader must compute: accident-year results excluding catastrophes, reserve development by line, reserves to surplus, and earned rate against loss trend. The accounting chapter shows how a loss-development triangle turns into earnings, why the calendar-year combined ratio contains prior-year development in full and the accident-year ratio does not, and which markers separate an aggressive balance sheet from a conservative one. The filings chapter walks through a Form 10-K, with Travelers (NYSE: TRV) as an example, and sets out the reporting calendar an insurance investor keeps.
Part VI, Analysis & Valuation. The sequence a practitioner runs, in order: business mix and the length of the tail first, then the reserve verdict read line by line, then the combined ratio normalized on the company’s own definition with rate set against the disclosed loss trend, and only then a return on equity, with the incentive test last. The reserve verdict comes early because a favorable headline can hide strengthening: Travelers’ $1,593m of adverse development on general liability accident years 2016 to 2024 sits inside nine of ten calendar years of reported net favorable development. The valuation chapter shows that price to book tracks return on equity closely across 54 listed insurers and reinsurers, and that the companies sitting off the line are the ones to study; it gives twenty years of price-to-book bands by type of company; and it prices control from the acquisitions of 2011 to 2026, a band of roughly 0.8 to 1.9 times book. The base-rates chapter carries the leaderboard, its survivorship correction, and the decomposition of the returns.
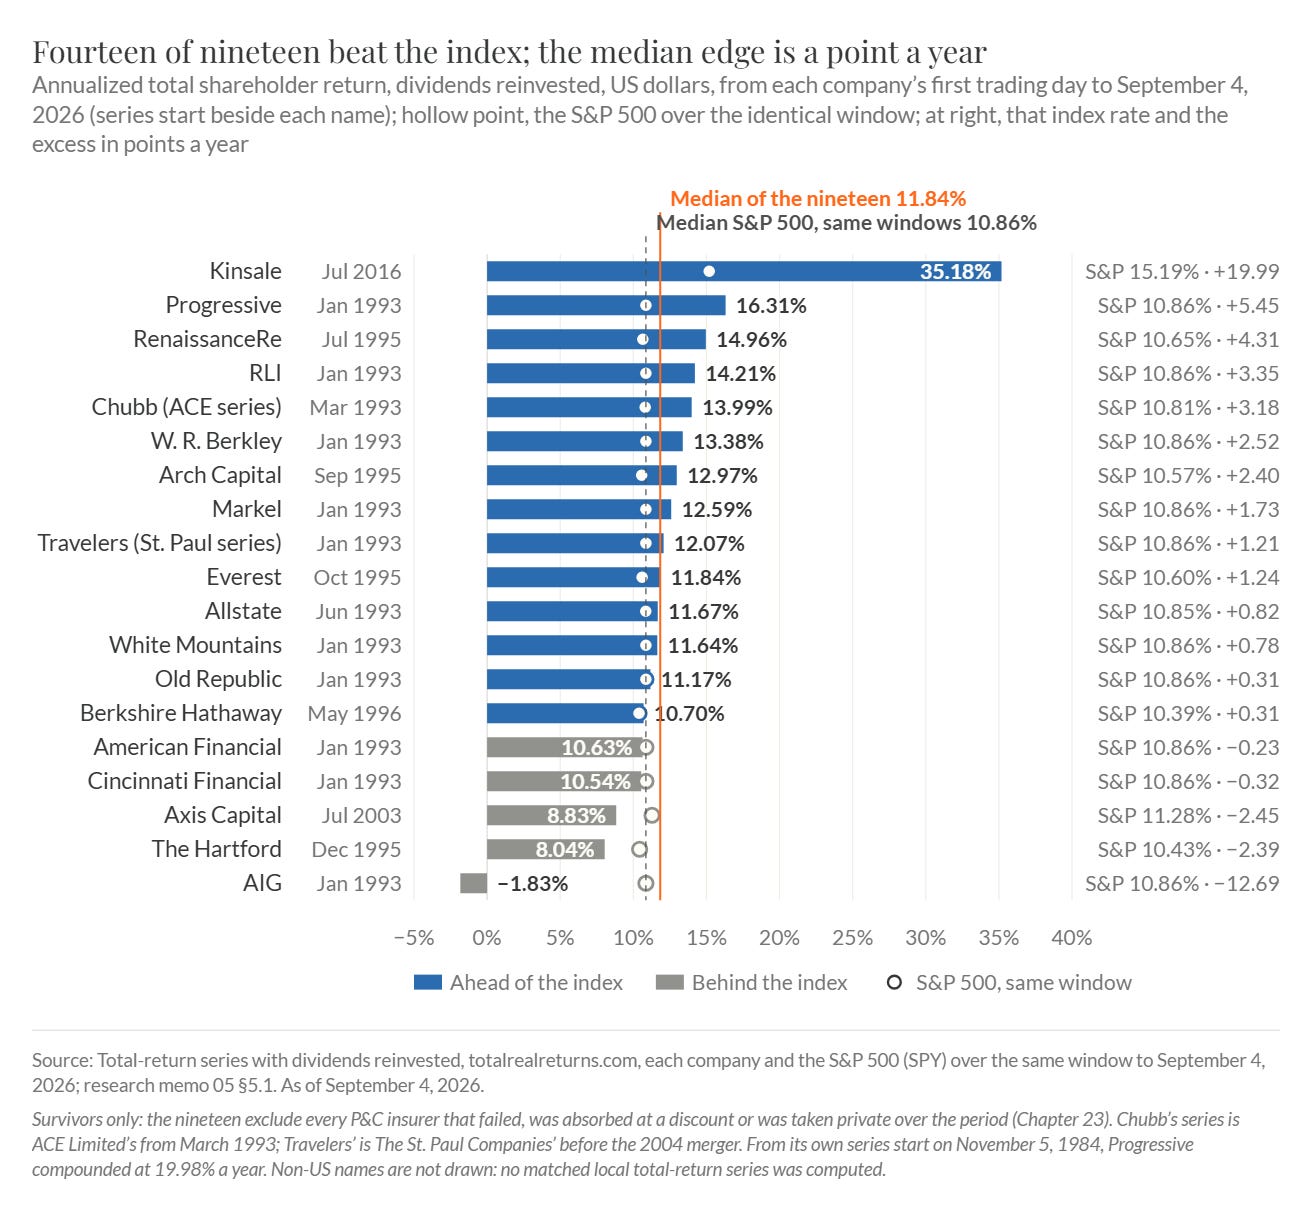
From Chapter 23: annualized returns, dividends reinvested, of nineteen listed insurers and reinsurers against the S&P 500 over each company’s own window from its first trading day to September 4, 2026. Fourteen are ahead of the index, and the median edge is about a point a year.
Part VII, The AI Inflection. Part VII separates what can be counted about AI in this industry as of September 2026 from what cannot. The report takes the catastrophe model of the 1990s as the precedent: the model replaced the underwriter’s distribution rather than the underwriter, and the losses came from what the model left out. The countable facts are few, and each is an operating fact rather than a ratio. AIG’s Lexington unit quoted 30% more submissions with AI assistance. Travelers consolidated its claims call centers from four to two, and roughly a third of its claims now settle without a human touch. Lemonade’s cost per claim is $19. The expense ratio, where the change would show, has not moved for it; Progressive’s went from 20.4% to 21.5% over the decade to 2025. Regulation is a filing burden rather than a prohibition, and the EU AI Act names life and health pricing as high-risk, not property and casualty. The test that would settle the argument is the loss ratio by underwriting cohort, which no company publishes.
Part VIII, Risks & Debates. Insurers fail in three ways, on three timescales: under-reserved long-tail casualty, which takes five to twenty-one years to end in insolvency; catastrophe concentration, which takes about two; and, once, a holding company’s borrowing while its insurance subsidiaries stayed solvent. Each failure showed up first in published disclosures, and the chapter lists ten early-warning indicators with where to read them and their current readings, from Everest Group’s (NYSE: EG) $1.5bn of adverse development in the fourth quarter of 2024 to the industry’s own other-liability line. The closing chapter describes the industry’s position in September 2026, the best results in a generation earned on falling premium, and works through the twelve live debates, facts first and proponents named: the cycle, the casualty reserves, insurability, alternative capital, the boom in excess and surplus lines, and whether AI ever reaches the loss ratio among them.
The appendices. The investable universe, one hundred listed names by segment with tickers, listing venues, market capitalizations, and one-line descriptions; a fifty-four-question due-diligence checklist in ten sections, in the order of the analytical procedure of Chapter 21; a reading list of books, shareholder letters and investor materials, interviews and podcasts, and data sources; and the sources for the report.
The companion deck. Fifty-three slides in the format of the Monday Morning Briefing, designed to be read without the report. It contains all 26 of the report’s exhibits, re-rendered for the slide format; the Executive Summary’s eight propositions on one slide; tables condensed from the report on the defining catastrophes, the return decomposition, the featured set, the several combined ratios one company reports, the expense-ratio record, and the early-warning indicators; the universe and the checklist; and three slides on material that has no exhibit in the report: the incentive structures at twelve owner-operated insurers, the four case studies, and the moats and the three tests that separate a moat from good weather.
What the primer is for. A reader who works through it should be able to explain how a property and casualty insurer makes money, and why the same risks earn one company a profit and another a loss; use the industry’s vocabulary, from float and the combined ratio to the accident year, the triangle, and the attachment point; read the filings without being misled by a calendar-year ratio, a headline development figure, or a book value struck on a different basis; appraise an insurer the way specialists do, in the sequence of Chapter 21, against price to book, return on equity, and the acquisition record; and recognize the managers and business models that have compounded value over decades, and the ones that destroyed it.
How to use this primer
The report does not need to be read in order. Suggested paths:
a generalist with limited time, Parts I and VI plus the checklist in Appendix B;
a reader interested in the history, Part II with Chapter 8;
an accountant, Part V;
an analyst working on a specific company, Chapter 14, then Parts III, V, and VI in order;
a risk officer, Part VIII with Chapter 26;
a technologist, Part VII;
a reader who came for the owner-operators, Chapters 15 and 16, with Chapter 8 for the episodes behind them and Chapter 23 for what their records are worth against the index.
Every chapter ends with a “What to remember” box, and the twenty-seven boxes read in sequence summarize the report. The checklist follows the order of the analytical procedure in Chapter 21, and the questions that can end the work come first.
Feedback and requests
Please reply to this email or leave a comment with what was useful, what was missing, any errors you find, and the industries you would like covered next. Member requests will inform the order of coverage.
This content is published by MOI Global for educational purposes only. It is not investment advice, an offer, or a solicitation, and no security mentioned herein is recommended for purchase or sale. The publisher and contributors may hold positions in securities discussed. Figures are believed accurate as of the dates stated but are not warranted; readers should verify all data against primary sources before relying on it. Nothing herein constitutes legal, tax, or accounting advice.