

We are delighted to share with you the third in-depth research report in our Industry Primers series, this one on US regional banks. The series exists to help fundamental, long-term investors expand and deepen their circle of competence, one industry at a time, and your feedback on what was useful and on which industries to cover next shapes what we produce. The report is complemented by two podcast episodes, the first telling the story of the industry and the second digging deeper into the fundamentals from an investor’s standpoint. Below, you will find two PDF files for download: the research report (members only) and the accompanying slide deck (free to access). We start with a quick anecdote:
Through the tightening cycle that ran from the first quarter of 2022 to the third quarter of 2023, the American banking industry passed half of the policy move into the price of its interest-bearing money, a cumulative deposit beta of 0.50. Westamerica Bancorporation (Nasdaq: WABC) passed through 0.02. Texas Capital Bancshares (Nasdaq: TCBI) passed through 0.80. In fiscal 2025 Westamerica paid 0.26% for its total deposits and Live Oak Bancshares (NYSE: LOB) paid 3.54%, against a median of 1.92% across the forty-eight banks the report features. At the industry’s price Westamerica’s interest expense would have been about $77m a year higher before tax and about $57m after it, against fiscal 2025 net income of $116m. The ranking also persists: the same eight banks have sat in the bottom quartile of deposit betas across three tightening cycles and twenty years.
That spread is where a bank’s earnings come from. A bank buys money from depositors in a defined territory, lends it back into that territory and lives on the difference at roughly ten times leverage, and the leverage is not a choice, since equity was 10.31% of assets across all insured commercial banks at December 31, 2025 against 6.14% at the end of 1984. What a management chooses is the price of the liability, the quality of the asset and the size of the cost base. Cullen/Frost Bankers (NYSE: CFR) works the model end to end: at December 31, 2025 it held $42.9bn of deposits, a third of them paying no interest at all, lent $21.9bn of that out, earned $1,736m of net interest income on a 3.66% taxable-equivalent margin, and after fees, operating cost, credit and tax was left with $649m of net income, a 1.23% return on average assets, 12.5 times leverage and a 15.3% return on average equity at a 63.5% efficiency ratio. There are three ways that line breaks: credit through the provision, where the industry charged off 0.57% of loans in the second quarter of 2026; rates through the margin and the equity at once, because deposits reprice when the bank chooses and fixed-rate assets do not; and liquidity, which is not a term in the equation at all. Silicon Valley Bank reported a 16.05% total risk-based capital ratio at December 31, 2022 beside an unrecognized held-to-maturity loss of $15,158m against $11,847m of tangible common equity, and more than $40bn left it on March 9, 2023 with about $100bn more expected the next day.
The long record is better than most investors assume and the recent one is worse. Kenneth French’s value-weighted portfolio of American bank stocks compounded at 11.46% a year from July 1926 to July 2026 against 10.35% for the market, and at 6.54% a year over the twenty years to December 2025 against the market’s 11.06%; the regional tier did 4.03% a year from June 2006 to December 2025 against 11.14% on the S&P 500 total return. The case for owning the industry rests on the dispersion rather than the average: over the twelve years to December 31, 2025 the featured banks grew tangible book value per share with dividends at a median of 9.82% a year, in a range from 4.87% to 20.11%, and over the twenty years to December 31, 2025 eight owner-operator records compounded at a median of 10.57% a year against the bank portfolio’s 6.54%, while Gregory Becker compounded SVB Financial at 16.57% a year for thirteen years and went to nothing on March 10, 2023. Every variable behind that gap was observable in advance in free public documents, and this primer is a working manual for reading them. This is one of a weekly series of primers whose purpose is to help readers expand or deepen a circle of competence, one industry at a time.
The companion deck. US Regional Banks: a self-contained summary of the report in slide form.

What’s inside
The primer has two parts, both attached to this post: a 248-page report and a companion deck that can be read on its own. The report has eight parts, twenty-seven chapters, and four appendices, with 30 exhibits, 23 tables, and two photographs; every figure is dated and sourced in the notes. The highlights, part by part:
Part I, Orientation. Why the industry is worth a week of work, the whole of a bank’s economics in one equation with one bank’s accounts behind it, and the map that statute rather than strategy drew. At June 30, 2026 there were 4,238 federally insured institutions holding $26.46tn of assets and $20.72tn of deposits, and each files the same quarterly Call Report, in the same line items, whether it holds $4bn or $700bn. The ten largest insured banks held $14.34tn of that, and the industry this primer is about is the next two hundred charters down. Chapter 2 builds the return on equity in two stages, five lines as a percentage of average assets and then a leverage multiple, so that what a management chooses is separated from what a regulator sets. Chapter 3 gives the size lines that govern strategy, from the $10bn debit-interchange threshold to the $100bn and $250bn supervisory lines, and the difference between the bank that files the Call Report and the holding company that files the 10-K, which is the most common source of error in reading bank data.
Part II, Evolution. Two and a half centuries told as one event repeated. The American peculiarity of thousands of small banks is a legal artifact: a federal tax on state banknotes in 1866 pushed state banks onto deposits and made the deposit the product, and the McFadden Act of 1927 froze the branching map for sixty-seven years. Deposit insurance changed what a bank is, turning roughly nine thousand suspensions in the four years to 1933 into nine insured failures in 1934. Deregulation then arrived in the wrong order, the price of deposits freed in 1980 and the powers to invest them in 1982 while the guarantee rose to $100,000, and Continental Illinois proved in May 1984 that a wholesale-funded bank can lose its funding in a week, at a cost to the FDIC of about $1.1bn. Between 1980 and 1994, 1,617 banks and 1,295 thrifts were resolved, and in Texas 425 commercial banks failed and nine of the ten largest holding companies failed or were sold, having been better capitalized than their peers by more than a quarter in 1980 to 1982. The crisis of 2008 to 2014 took 507 banks and $69.6bn of the insurance fund and drove the fund to a negative $20.9bn. March 2023 was the same lesson at modern speed: Silicon Valley Bank closed on March 10 against $175.4bn of deposits, Signature Bank followed on March 12 and First Republic Bank on May 1, all depositors were made whole under a systemic-risk exception, and the industry was charged a $16.3bn special assessment for it. The era the primer is written inside opened with the regulators moving faster: approvals now take four to six months against a year and more in 2021 to 2024, Banco Santander completed the purchase of Webster Financial for about $12.3bn on August 20, 2026, and five banks failed in 2026 through September 21 with under $700m of assets between them.
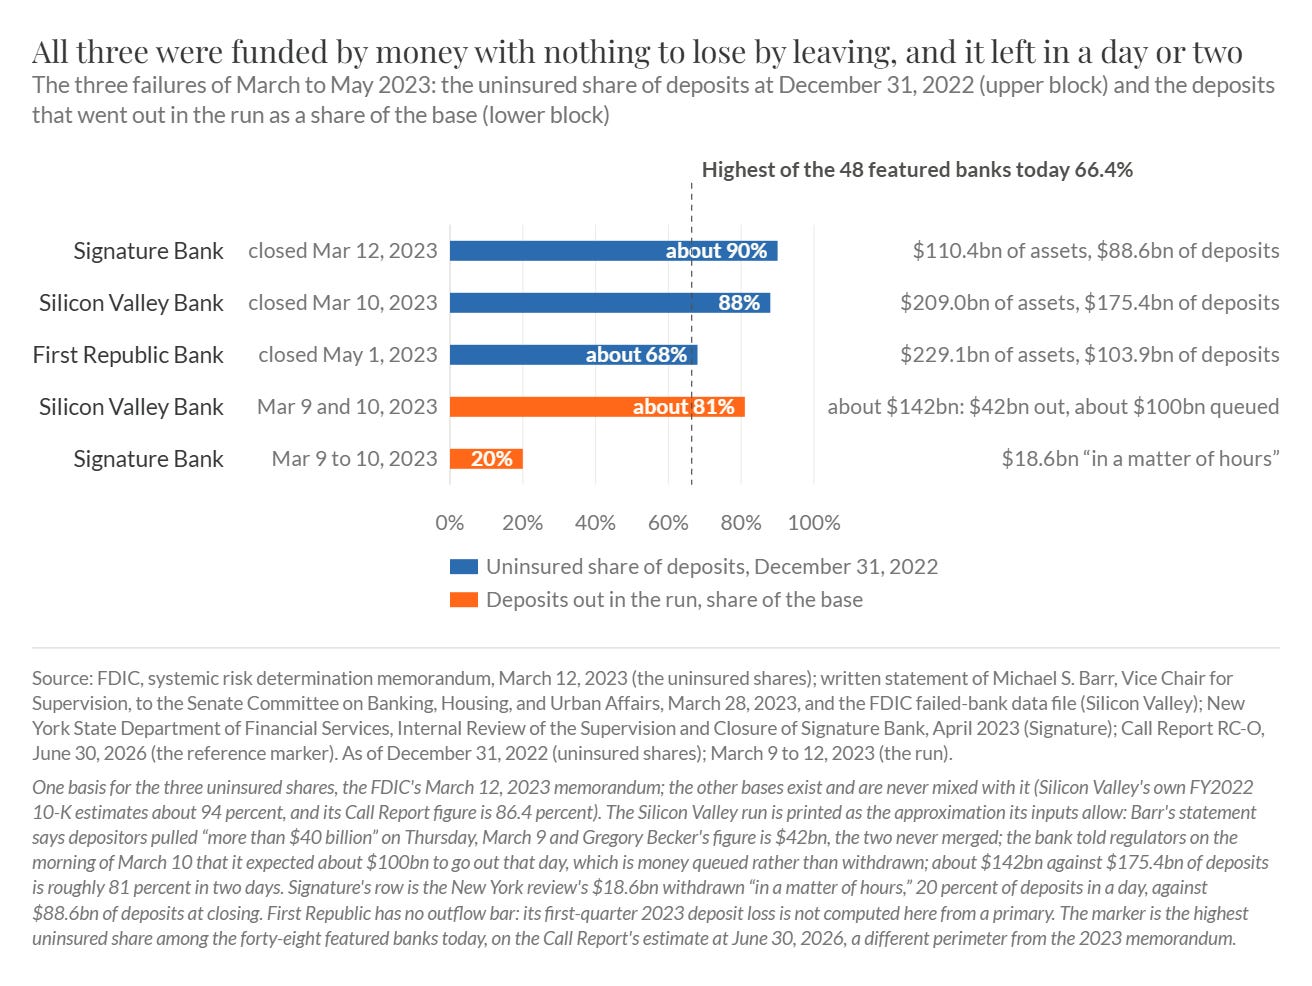
From Chapter 6: the three banks that failed in 2023, their uninsured deposit shares at December 31, 2022 against the industry’s, and the deposits withdrawn and queued, with the closing date and the acquirer on each bar. More than $40bn left Silicon Valley Bank on March 9 with about $100bn more expected the next day.
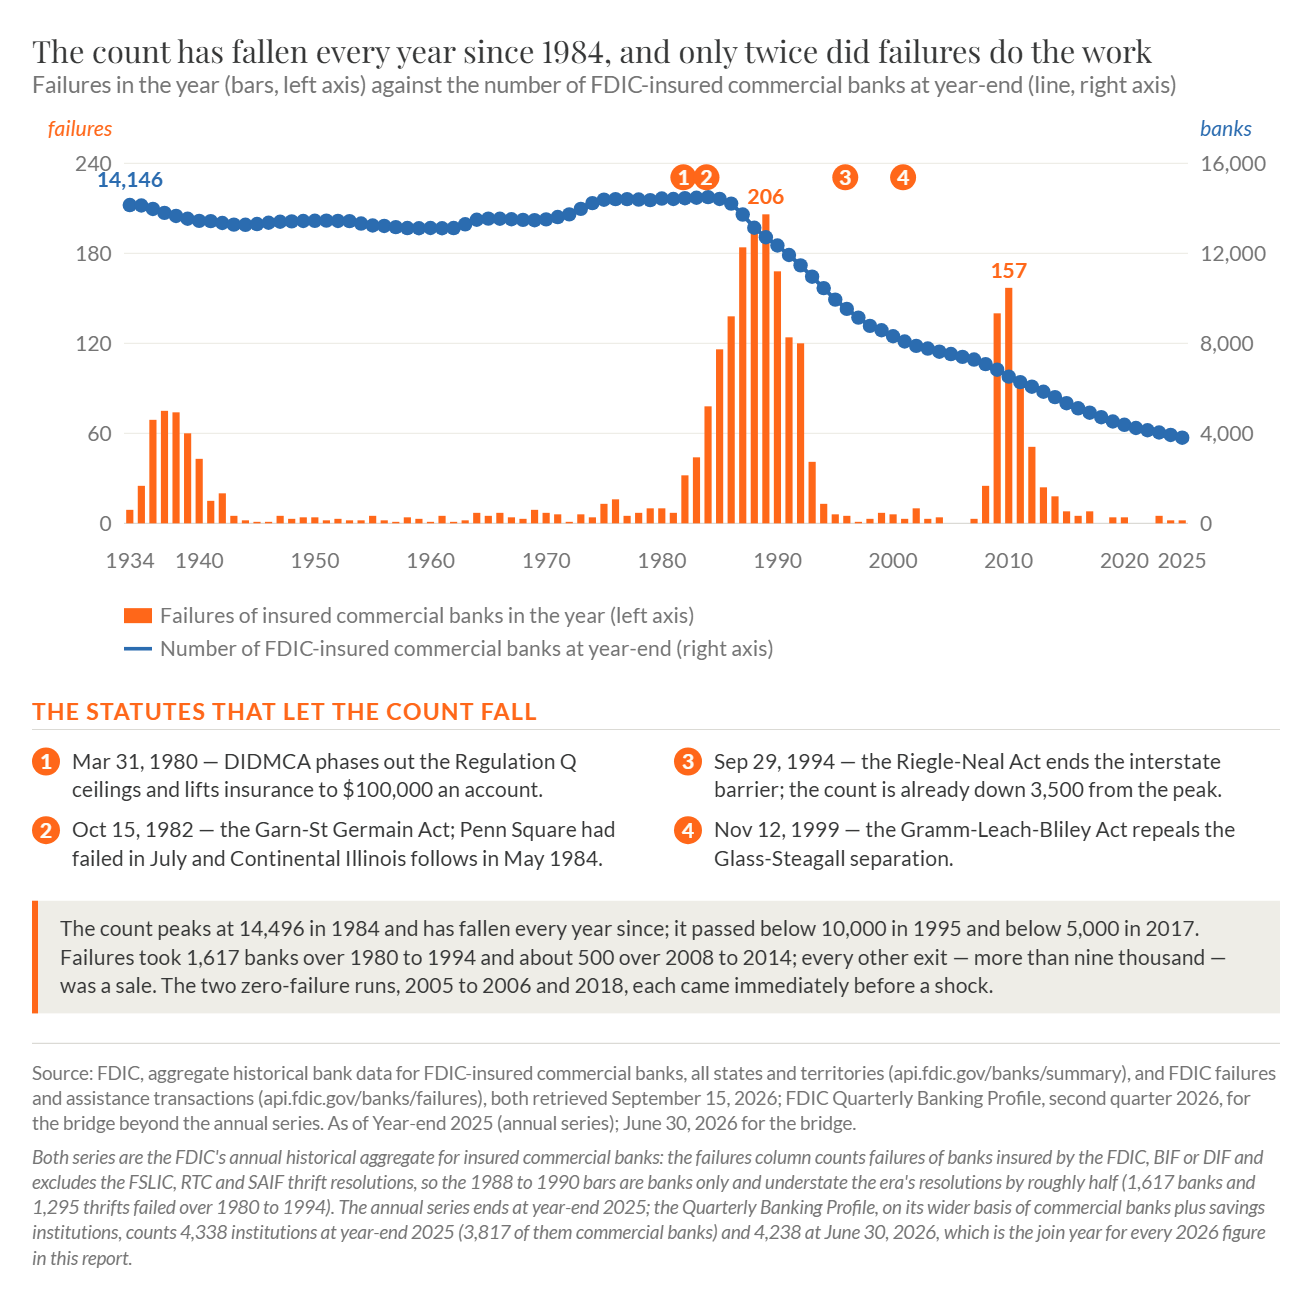
From Chapter 7: insured institutions by year against failures and assistance transactions, with the 1984 peak and the failure waves flagged. There were 14,496 insured commercial banks at the 1984 peak and 3,728 at June 30, 2026, and mergers rather than failures did almost all of the work.
Part III, Structure & Economics. The two halves of the balance sheet, then the return, the models and the moats. The deposit chapter is first because the deposit is the product: the cost of interest-bearing money across the featured set ran from 0.50% to 3.95% in fiscal 2025, an eightfold range on the largest cost line of a business levered ten to one, and the uninsured share measures what can leave quickly rather than how firmly the money is held, because what matters is whether a balance is operating or investable. The loan book is read for concentration before yield, since the average loss is survivable by design: the industry’s net charge-off rate has averaged 0.71% a year since 1967 and has exceeded 1.25% in only two episodes in sixty years, peaking at 1.58% in 1991 and 2.62% in 2009, and the 2021 reading of 0.24% is the worst possible base for a through-the-cycle assumption. Concentration is measured against capital on the interagency guidance of December 2006, where Bank OZK (Nasdaq: OZK) is the only featured bank above the construction line at 120% of total risk-based capital while Westamerica does no construction lending at all. The rate chapter puts $326.7bn of industry unrealized securities losses at June 30, 2026 beside the $689.9bn peak of the third quarter of 2022. The moats chapter keeps two edges that can be measured from free data, the cost of the liability and the community lender’s knowledge of borrowers who do not fit a score.
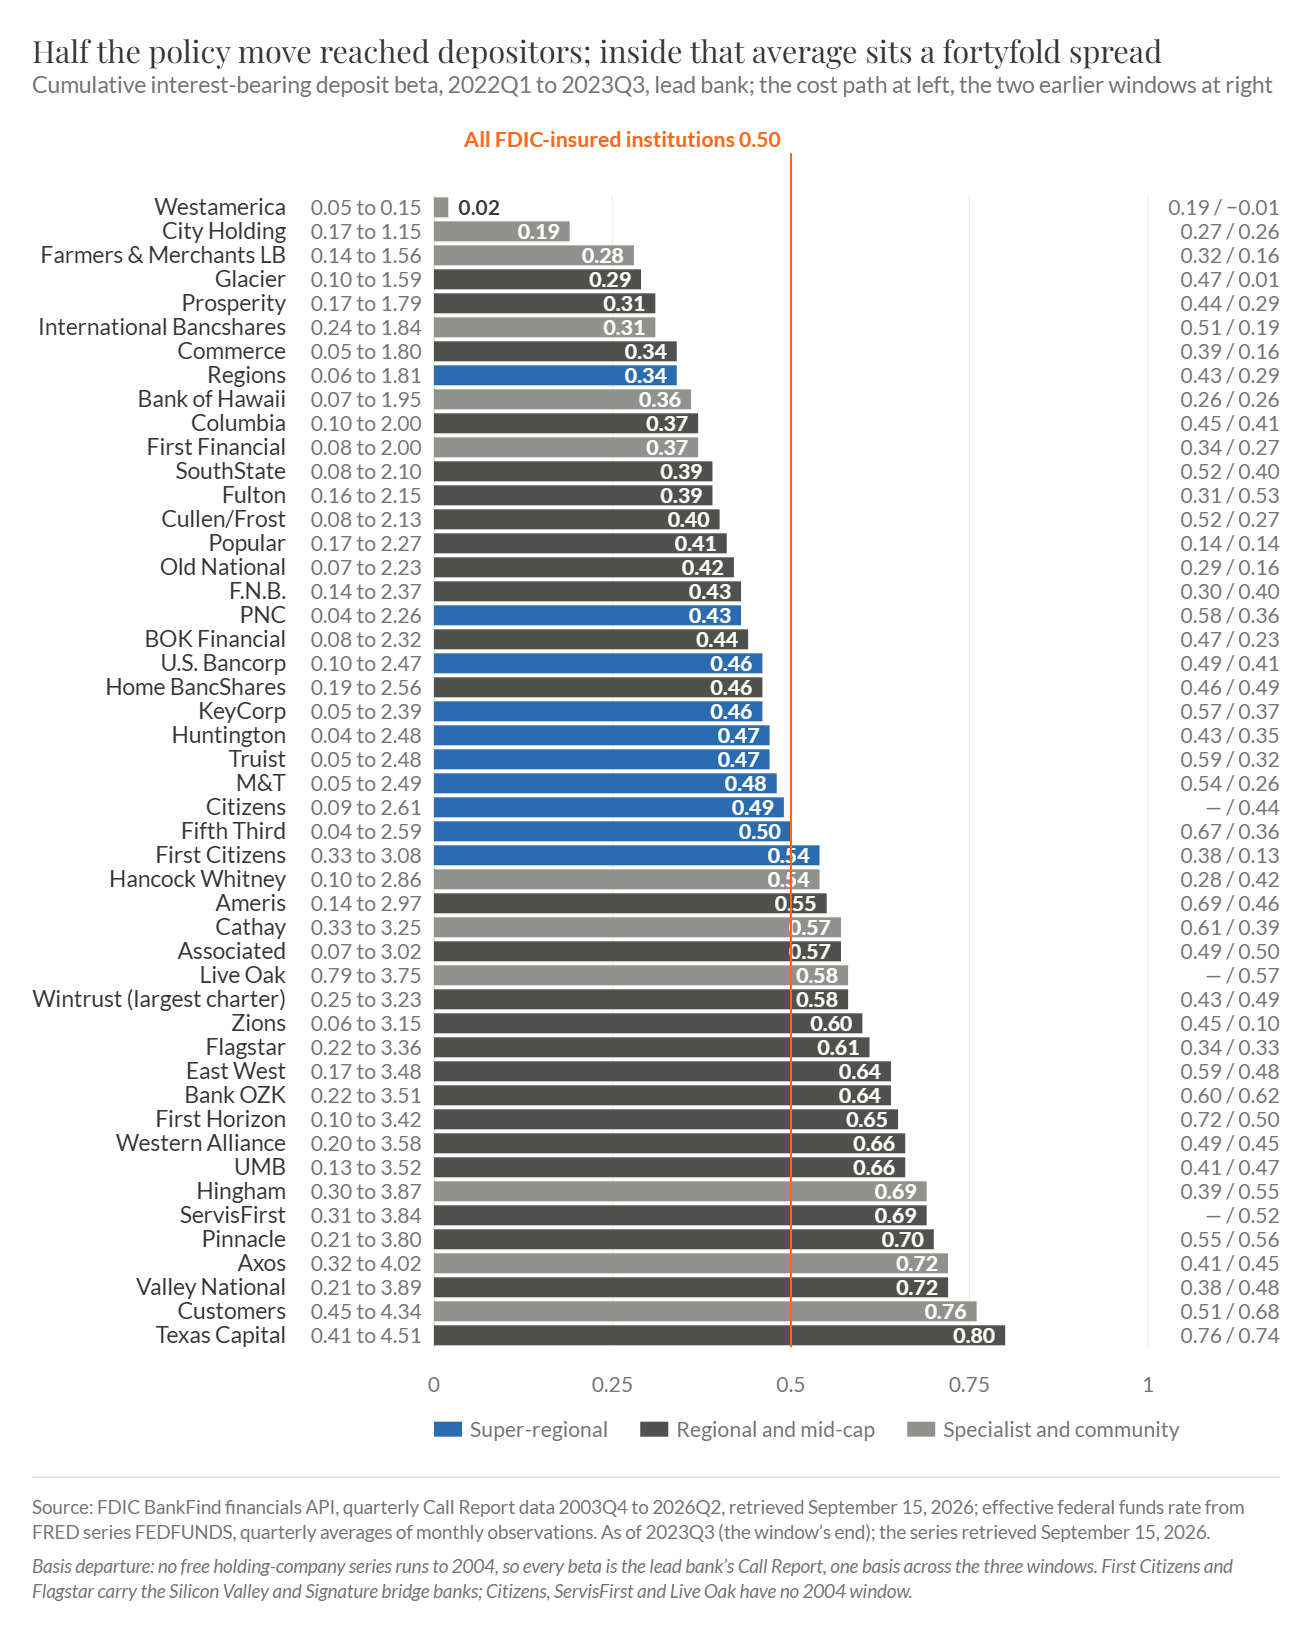
From Chapter 9: the cumulative interest-bearing deposit beta of forty-eight lead banks across the tightening windows of 2004 to 2006, 2015 to 2019 and 2022 to 2023, with the industry line on the third. The industry passed through 0.50 in the last cycle and the featured banks ran from 0.02 to 0.80.
Part IV, The Players. The forty-eight featured banks on one page at one date, then the people. On one set of definitions the net interest margin runs from 1.69% to 5.12%, the efficiency ratio from 31.7% to 93.2%, common equity tier 1 from 10.23% to 21.11%, the uninsured share from 16.6% to 66.4% and price to tangible book from 0.75x to 2.50x, which is why the industry cannot be analyzed as one business. Two chapters give the owner-operators and the allocators their records on one basis, tangible book value per share with dividends added undiscounted, with both dates printed: over the twenty years to December 31, 2025, against an index at 6.54% a year, Frank B. Holding Jr. compounded First Citizens BancShares (Nasdaq: FCNCA) at 15.13%, David Zalman compounded Prosperity Bancshares (NYSE: PB) at 12.59% and Johnny Allison compounded Home BancShares (NYSE: HOMB) at 12.46%, at a median of 10.57% across the eight comparable records. The levers are few and they repeat, and the largest is the purchase of a failed institution from the receiver, used by seven of the seventeen leaders profiled and available only in 1988, in 2008 to 2014 and in 2023: First Citizens bought roughly $72bn of Silicon Valley Bridge Bank’s assets at a $16.5bn discount on March 27, 2023. The group’s common and unpriced exposure is succession, since George Gleason has run Bank OZK for forty-seven years and David Payne has run Westamerica for thirty-seven with no announced successor between them. A chapter on the balance sheets that file no proxy covers the FDIC, which held $161.1bn at a 1.48% reserve ratio at June 30, 2026 and decides who buys a bank when one fails; the Federal Home Loan Banks, whose advances rose from $827bn at December 31, 2022 to $1.05tn at March 31, 2023; and the credit unions, 4,250 tax-exempt institutions holding $2.48tn.
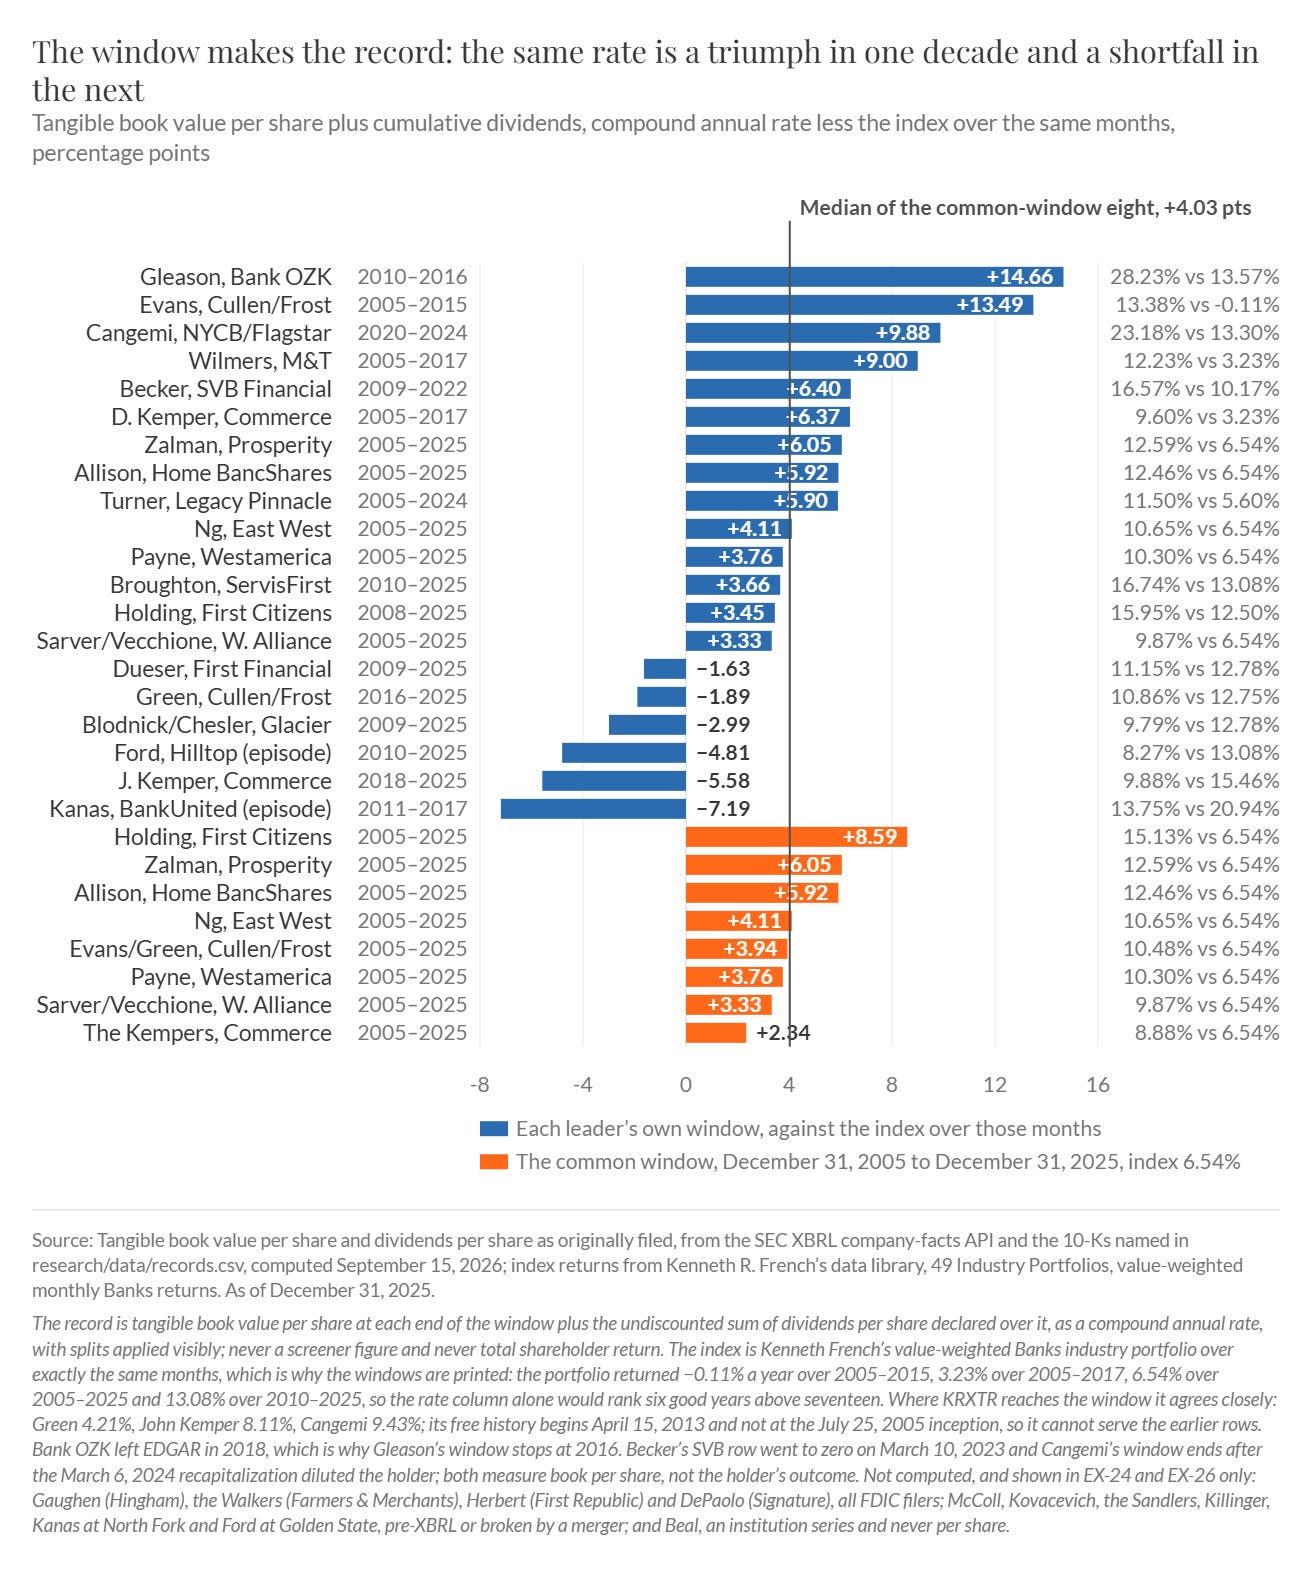
From Chapter 16: the leaders’ records on tangible book value per share with dividends added undiscounted over each tenure’s free window, drawn as the spread against the index named on each row. The cautionary rows end at zero.
Part V, Speaking the Language. Part V is the reference section. Nine descriptors travel with every bank figure, from the entity and the period convention to the efficiency-ratio definition and the fiscal year, and a figure without them cannot be compared with anything, which is why Cullen/Frost’s fiscal 2025 cost of deposits is 1.89%, 1.87% and 1.85% in three defensible places. M&T Bank (NYSE: MTB) reports a 56.0% efficiency ratio for 2025 on its own definition against 56.7% on the standard one from the same filing, which is what an honest adjustment looks like. The accounting chapter shows that reported capital and book value are the output of three choices, the securities classification, the size of the reserve and the treatment of the marks, and that the work is to undo all three: the industry’s allowance went from 1.15% of loans at the end of 2019 to 2.16% at the end of 2020 and 1.61% at the end of 2025 while realized losses ran the other way. The filings chapter reads a bank 10-K in the order the questions arise rather than the order it is bound, and notes that some of the best banks in the set, Bank OZK and Hingham Institution for Savings (Nasdaq: HIFS) among them, file with their banking regulators rather than with the Securities and Exchange Commission, so an EDGAR search reports that they do not file at all.
Part VI, Analysis & Valuation. The sequence a practitioner runs, in order, and what the record says it is worth. The analysis is liability-side first because every failure began on the right-hand side of the balance sheet: the mix, the price, the beta, the uninsured share and the tenure of the deposits, then the loan book read for concentration, then the securities book, then capital read twice, as reported and with the marks taken. Price to tangible book is a statement about the return on tangible common equity and about the honesty of the book, and the market says the second clause carries most of the weight: regressed across ninety-five listed banks at the September 11, 2026 close, the fitted line is 0.96 plus 0.0607 times the return in percent, with an R² of 0.24, and the residuals show Glacier Bancorp (NYSE: GBCI) paid 2.03x tangible book on an 8.1% return while ServisFirst Bancshares (NYSE: SFBS) earns 14.1% at 1.17x. A private buyer settles the same question in cash, and the 2025 and 2026 wave was struck at 1.53x to 1.93x tangible book and 6.6% to 8.6% of total deposits. Statistical cheapness is usually a funding or a credit problem still being reported, which is what Flagstar Financial (NYSE: FLG) at 0.75x tangible book is, with the set’s highest cost of interest-bearing money at 3.95% beside it. The base-rates chapter carries the leaderboards with their survivorship correction: of roughly 18,463 insured charters alive at the end of 1984, 3,451 were still operating in September 2026, and most of the exits were sales at a premium rather than failures.
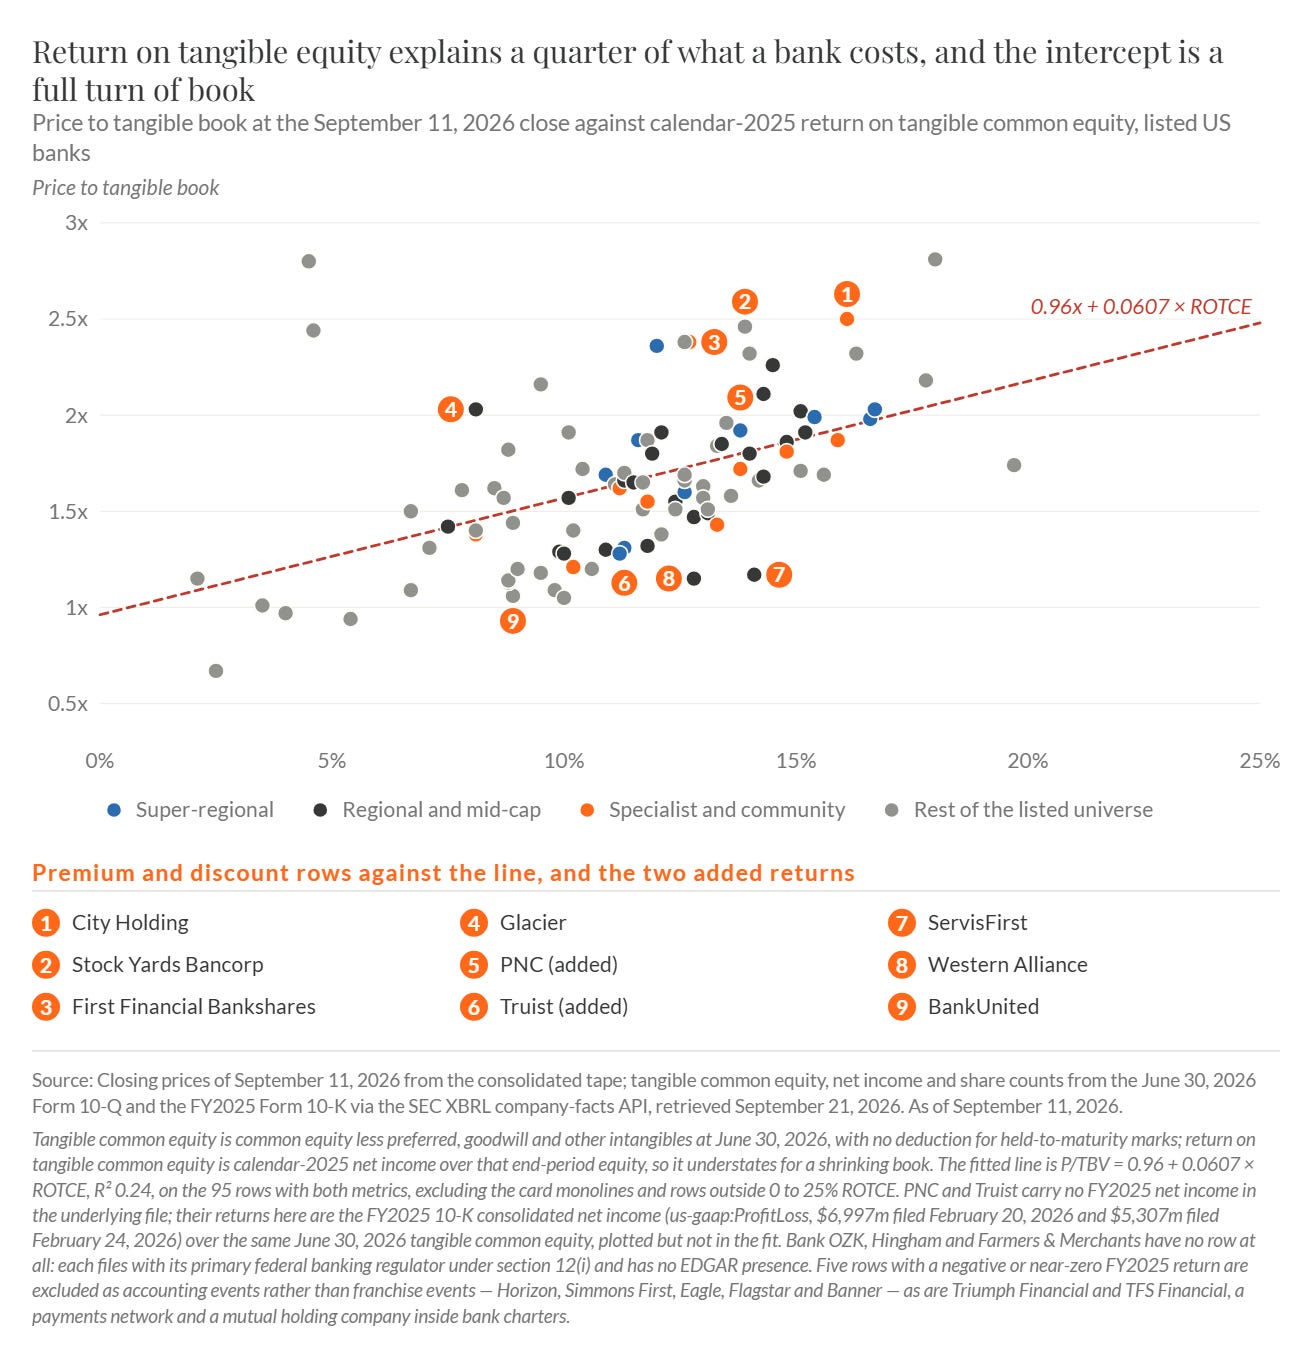
From Chapter 22: ninety-five listed American banks at the September 11, 2026 close on June 30, 2026 tangible book, with the fitted line and its R² of 0.24 printed and the featured set marked. The return explains about a quarter of what an American bank costs on one day.
Part VII, The AI Inflection. American banking has been algorithmic since bureau-based credit scoring spread in the late 1980s, so the part counts what can be counted and names the ratio that would have to move. Through the middle of 2026 the featured set shows no move in the cost line: the median efficiency ratio at the lead bank is 1.4 points better than in 2019 while the ten super-regionals are 1.3 points worse, and the median fiscal 2025 annual report mentions artificial intelligence twice, almost always in risk factors. The competitive fact is the absolute dollar rather than the share of revenue, since JPMorganChase’s tagged technology caption was $11.0bn in fiscal 2025 against M&T’s $558m and Westamerica’s $10.8m, which is why a regional bank buys its core processing from a market in which three vendors hold 72% of bank relationships. The exposure that matters sits on the liability side and no bank publishes it: what a bank’s deposits would cost if every retail customer held a tool that moved balances to the best insured rate weekly has no published answer at any of the forty-eight.
Part VIII, Risks & Debates. Banks die of credit, of rates or of liquidity, and the three are separable in the filings even when they arrive together. Each announces itself two to eight quarters ahead in lines a reader can watch, from loan growth far above peers and the concentration ratios to unrealized losses against common equity tier 1 and the uninsured share beside brokered funding. One mode gives no warning: several of the failures since the March 2023 cohort were frauds rather than credit or rate events, among them the chief executive of Heartland Tri-State Bank who embezzled about $47.1m, and a falsified collateral file moves no ratio until the loss is recognized. Most capital in this industry is destroyed without a failure at all, by growth into a hot market, by wholesale funding, by holding-company leverage and above all by the dilutive rescue raise. The closing chapter describes the position in September 2026, facts first and proponents named: insured institutions earned $90.1bn in the second quarter at a 1.37% return on assets on a 3.32% net interest margin with forty-seven banks on the problem list, while the Federal Open Market Committee raised the target range to 3.75 to 4.00 percent on September 16, 2026 against $326.7bn of unrealized securities losses of which $216.9bn sits where no mark is taken. Eleven debates follow, among them commercial real estate and lending to non-depository financial institutions, up 22.4% in the year to about $1.5tn.
The appendices. The investable universe, 109 listed banks and thrifts grouped by tier and region with tickers, venues, assets, market values and one-line descriptions, and the card and consumer-finance charters set out as a labeled adjacent block with the reason they are not regional banks; a forty-two-question due-diligence checklist in seven sections, in the order of the analytical procedure of Chapter 21, with a free source named for every question; a reading course of shareholder letters, transcripts, regulators’ post-mortems, books and data sources; and the 312 numbered notes that source the report.
The companion deck. The report in the format of the Monday Morning Briefing, designed to be read without the report: the exhibits re-rendered for the slide format, the eight propositions of the Executive Summary, the tables that carry the argument, the universe and the checklist, and slides for material that has no exhibit in the report.
What the primer is for. A reader who works through it should be able to explain how a regional bank makes money, and why two banks earning the same return on equity are not the same business; use the industry’s vocabulary, from the deposit beta and the uninsured share to the efficiency ratio, the accumulated other comprehensive income election and the allowance; read the filings without being misled by a capital ratio struck before the marks, an adjusted efficiency ratio or an acquirer’s accreting loan mark; appraise a bank the way specialists do, in the sequence of Chapter 21 and against price to tangible book, return on tangible common equity and the prices private buyers pay for deposits; and recognize the managers and business models that have compounded value over decades, and the ones that ended at zero.
How to use this primer
The report does not need to be read in order. Suggested paths:
a generalist with limited time, Parts I and VI plus the checklist in Appendix B;
a reader interested in the history, Part II with Chapter 8;
an accountant, Part V;
an analyst working on a specific bank, Chapter 14, then Parts III, V, and VI in order;
a risk officer, Part VIII with Chapter 26;
a technologist, Part VII;
a reader who came for the owner-operators, Chapters 15 and 16, with Chapter 23 for what their records are worth against the index.
Every chapter ends with a “What to remember” box, and the twenty-seven boxes read in sequence summarize the report. The checklist follows the order of the analytical procedure in Chapter 21, and the eight questions on the deposit franchise come first, because a bank whose funding fails that block will not be saved by the thirty-four questions after it.
Feedback and requests
Please reply to this email or leave a comment with what was useful, what was missing, any errors you find, and the industries you would like covered next. Member requests will inform the order of coverage.
This content is published by MOI Global for educational purposes only. It is not investment advice, an offer, or a solicitation, and no security mentioned herein is recommended for purchase or sale. The publisher and contributors may hold positions in securities discussed. Figures are believed accurate as of the dates stated but are not warranted; readers should verify all data against primary sources before relying on it. Nothing herein constitutes legal, tax, or accounting advice.