

It was our great pleasure to welcome Chris Bloomstran back to the Zurich Project, held June 2-4, 2026. Chris has become a fixture of the gathering, and his session was among the most anticipated of the week. He called the event “a highlight of my year”; the feeling is mutual. We are grateful to Chris for once again sharing his wisdom, his data, and his unvarnished views with the group. Zurich Project proceedings are kept confidential by default; with Chris’s approval, we are sharing the audio replay, the full transcript, and his 54-page slide deck with members.
Chris is President and Chief Investment Officer of Semper Augustus Investments Group, the value-oriented firm he co-founded in 1998. His annual client letters, which routinely run past a hundred pages, contain what many regard as the most rigorous outside analysis of Berkshire Hathaway available anywhere. Few practitioners combine bottom-up valuation discipline with capital-cycle history the way Chris does. For a fuller portrait, we encourage you to listen to our exclusive audio program, Chris Bloomstran and the Semper Augustus story.
The most expensive cap-weighted market in US history
Chris opened with the table he has kept in his letters for over twenty years, comparing today against the secular peaks of 1929, 1937, 1966, 2000, 2007, and 2021. The S&P 500 ended 2025 at 26 times operating earnings, matching 1929 and approaching the 29 times of early 2000. The CAPE ratio stood at 40, a record. Adjusted for this year’s roughly 10% advance, price to sales is now 3.8 times and price to book 6.2 times. With about $70 of index dividends against an S&P at 7,600, the dividend yield sits near 1%, an all-time low. The yield reflects a record-low 27-28% payout ratio, down from roughly 60% a generation ago; a quarter-century of buybacks consuming half of operating cash flow never shrank the share count, because some 2% of shares are granted to insiders each year. His verdict: “You will not find a moment in the history of the United States cap-weighted stock market where valuations have been higher than today.”
The title is self-deprecating. Chris called a secular peak in his 2021 letter; 2022 obliged with an 18% S&P decline and 35% on the Nasdaq, but the recovery carried valuations above the 2021 highs. Borrowing Irving Fisher’s infamous “permanently high plateau,” he now calls it a secular plateau.
The arithmetic of buying high
The Ibbotson series puts long-run US equity returns at 10.1-10.2% annually from the end of 1925. Buy the exact 1929 top and you compounded at 9.7%; buy the June 1, 1932 low (the S&P at $4.40, down 86%) and you compounded at 12%. That spread compounds brutally: $100 invested at the 1932 low grew to $10,000 by the end of 1964, a hundredfold gain in a third of a century. Berkshire then turned each $100 of 1964 value into $6.1 million by 2025 (19.7% a year) versus $45,000 for the S&P 500. Berkshire’s stock could have fallen 99.26% and still matched the index. When Chris shared that statistic with Warren Buffett years ago, Buffett replied, “Ben would be proud, but let’s not test the math.” Charlie Munger’s in-person response at a Wesco meeting is worth the price of admission.
A T-bill over the index, but cash has a clock
Offered the choice between the cap-weighted S&P 500 and a Treasury bill today, Chris would own the bill. The excess sits not in every stock but in the Magnificent Seven and perhaps 50 or 60 other large companies at very full prices. Yet cash, he stressed, is a terrible long-term asset. His opportunity-cost table shows that with stocks compounding at 10% and cash at 3%, the market must fall 28% within five years, 48% within ten, for the cash holder to break even. Semper Augustus resolves the tension by owning roughly 25 businesses that look nothing like the index. “Time in the market is better than timing the market, and that is the absolute truth.”
Five factors, two case studies
Chris does not value companies using a DCF. His framework decomposes total return into five drivers: dollar sales growth, margin change, multiple change, share-count change, and dividend yield. Two Berkshire holdings illustrate it. Coca-Cola, bought for $1.3 billion at 15.7 times earnings, grew to $16 billion and 58.5 times by mid-1998, when it was half of Berkshire’s portfolio. Since then: sales up 3.4% a year, margins up to 26.7%, the multiple down 60% to 23, buybacks adding 0.5% and dividends 2.8% annually. Net result, 4.6% compounded for 27 years from a great business. Apple, bought at 13.9 times earnings (10 times net of cash), has compounded at 29.4%, but with the multiple now at 34.5 times and sales growth slowing, Chris’s scenarios produce zero to 7.5% forward returns. Berkshire has sold 80% of its shares, which he calls a very good sale. The 1998 General Re acquisition, paid for with 280,000 Berkshire shares at three times book, halved an overvalued equity portfolio and let book value compound at 11.2% since, ahead of the 9.2% the stock portfolio itself delivered. A masterstroke, in Chris’s words.
Margins, the Mag 7, and the road to Ibbotson
In his 1999 Fortune piece, Buffett observed that profit margins had ranged between 4% and 6.5% over his lifetime. The S&P 500 net margin ended 2025 at 12.8% and is headed for 14.5-15% this year, as a handful of companies, Nvidia foremost as its profit goes from $100 billion toward $200 billion, add some $300 billion to aggregate index earnings, taking them from $2.5 trillion toward $2.8 trillion. The Mag 7 earned their weighting, rising to 26.8% of index profits and accounting for 60% of all profit growth from 2021 through 2025. But the implied future is demanding. To deliver Ibbotson’s 10.5% over the next decade, margins must reach 20.7% at a constant 26 multiple, or the multiple must reach 43 times at constant margins. Hold both flat and the return is sales growth plus dividends, roughly 4.5%. Chris finds the 10.5% case implausible and expects the index to trade substantially below current levels at some point within ten years.
The AI capital cycle
The sharpest section of the talk applied capital-cycle history (canals, railroads, autos, electrification, fiber) to the AI buildout. The fiber precedent: roughly 1% of GDP spent, only 4% of fiber lit by 2021, most issuers bankrupt, yet the infrastructure eventually enabled YouTube and Netflix. Hyperscaler capex was $400 billion last year, is projected at $750 billion or more this year, and totals $1.3-1.4 trillion to date, with 2023-2030 estimates of $4 trillion and now as high as $7 trillion. The depreciation math is unforgiving: $400 billion of capex on a ten-year straight line creates $40 billion of year-one depreciation against AI revenues of $40-50 billion. A 20% return on $4 trillion requires $800 billion of profit, nearly a third of all S&P 500 earnings. Capex consumed 41% of the big four hyperscalers’ operating cash flow in 2023; in 2026 it will consume essentially all of it. Layer on roughly $650 billion of off-balance-sheet financing, such as Meta’s $30 billion, 5-gigawatt Hyperion data center, financed through a Blue Owl joint venture with just $500 million of Meta equity and a Meta debt guarantee, and Chris hears echoes of Enron and Lucent. He is waiting for the first hyperscaler to cite EBITDA on an earnings call.
Berkshire, the discipline case study
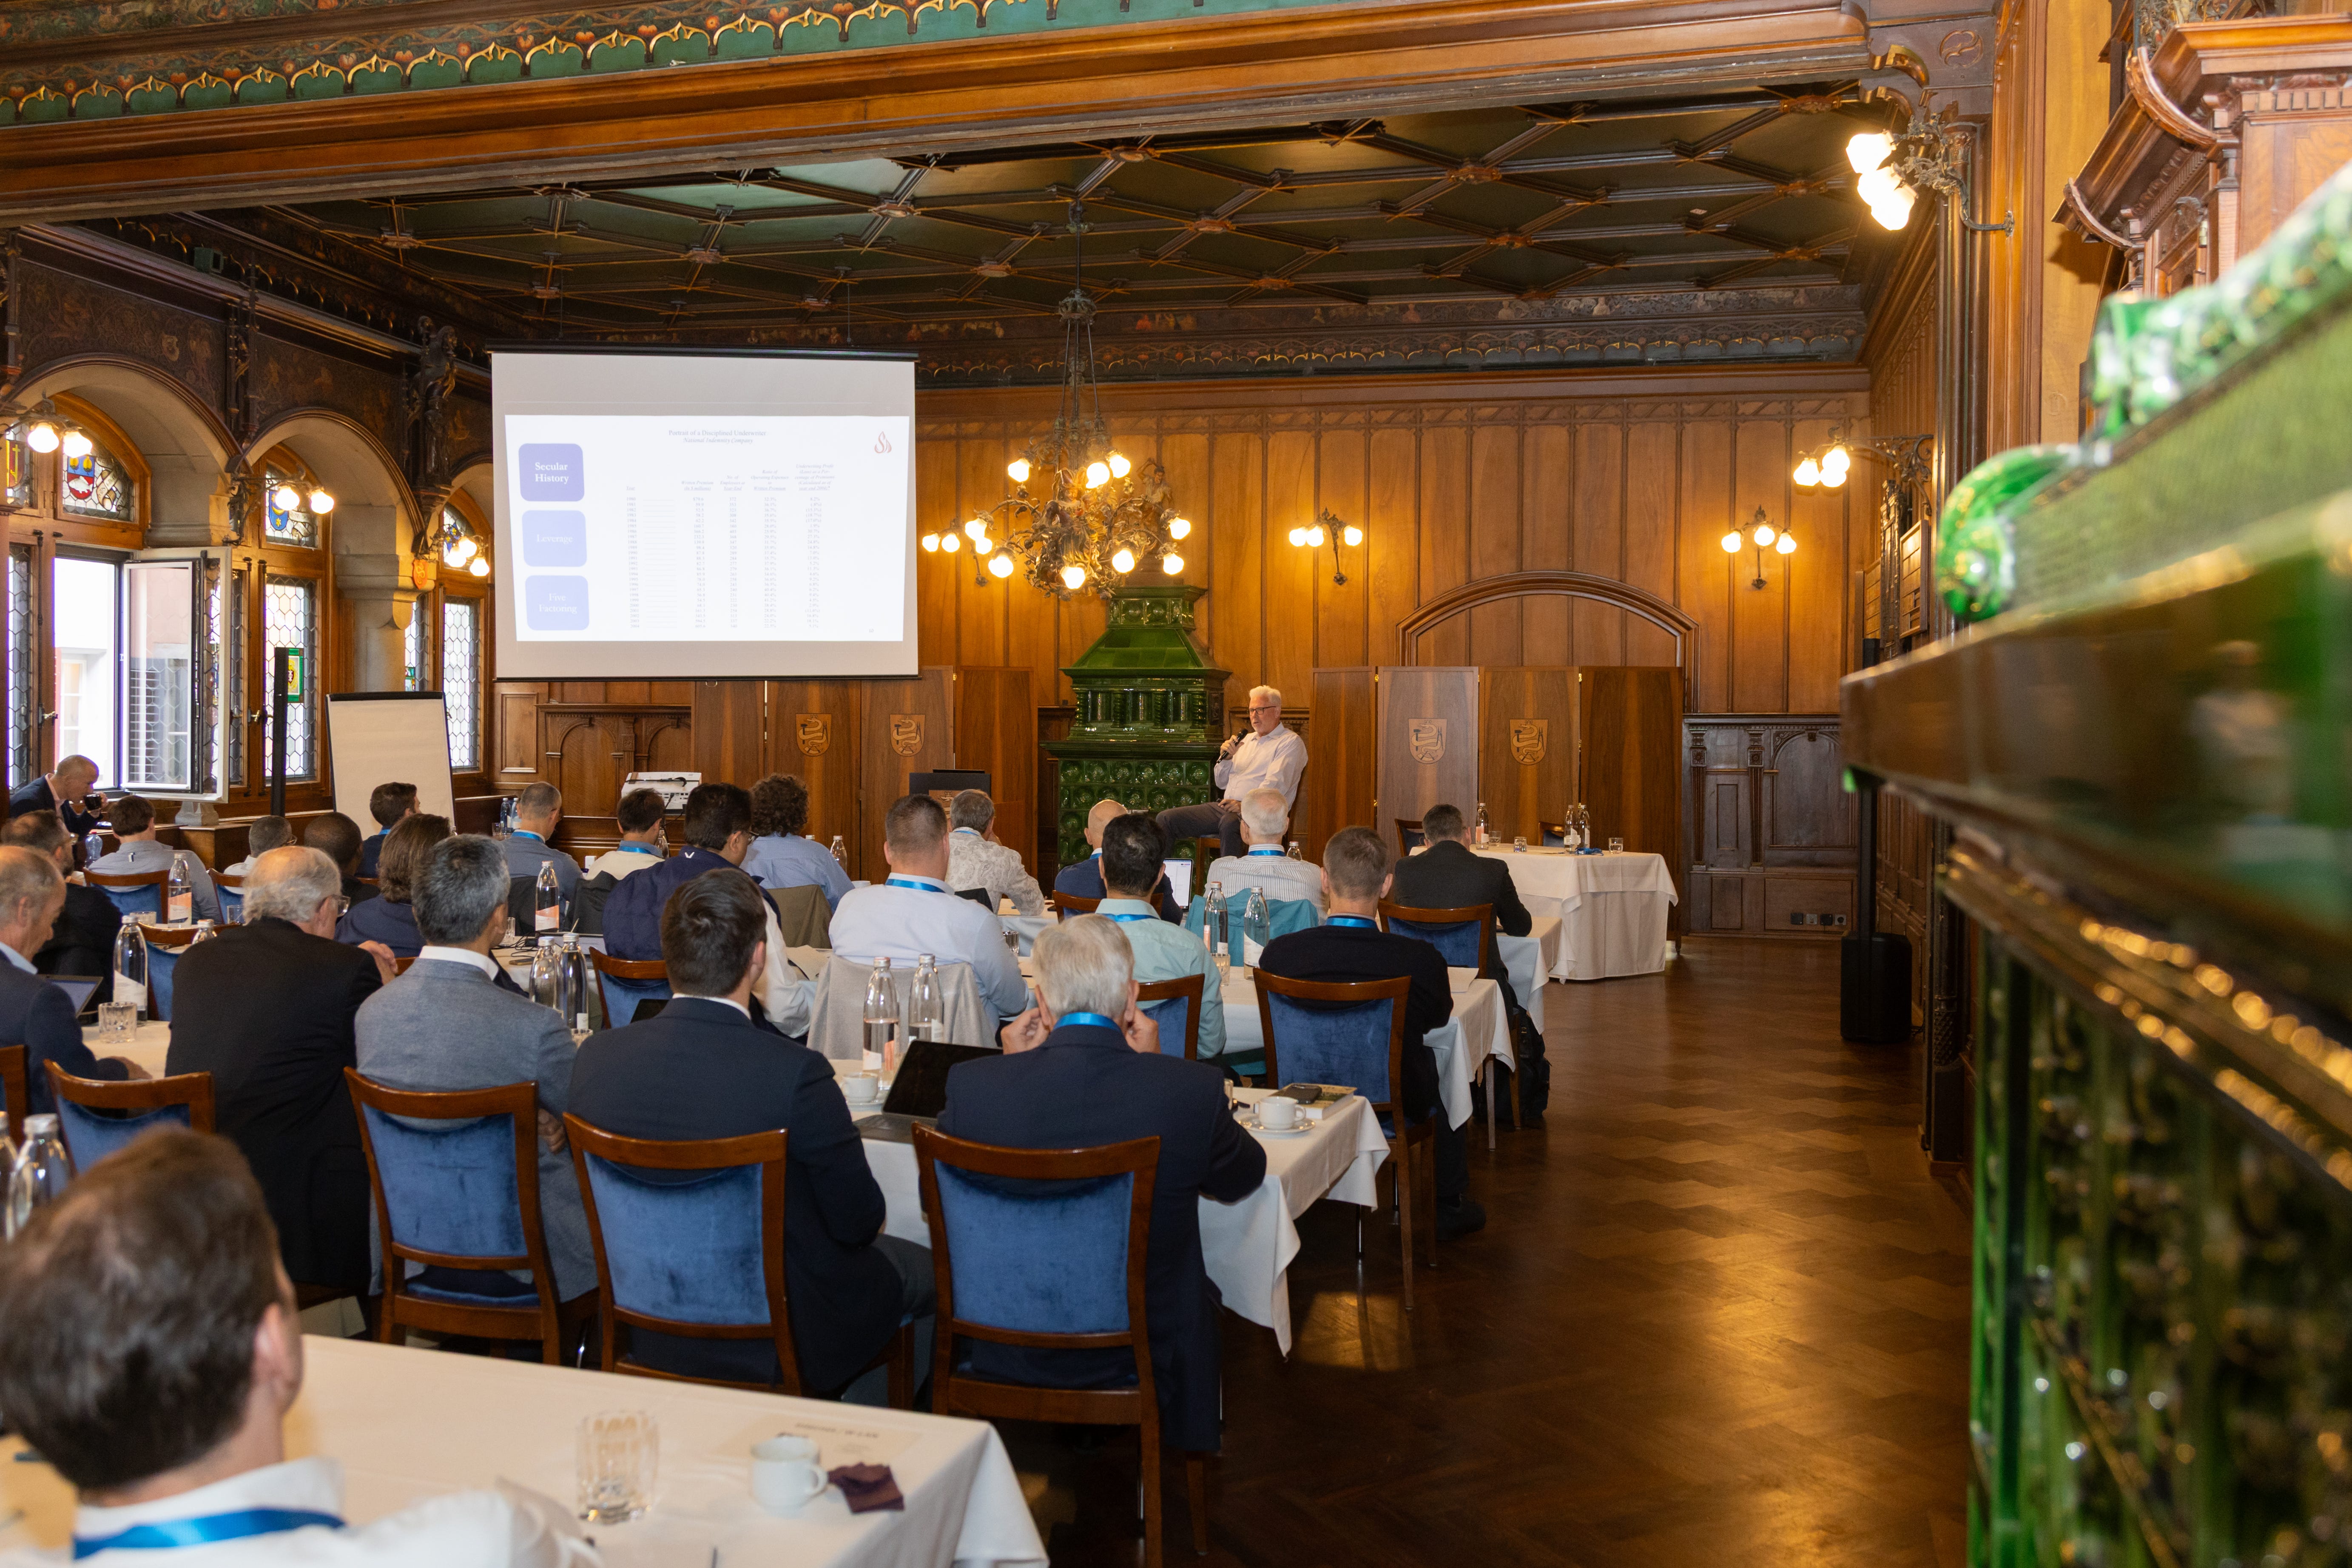
The counterexample is the company Chris knows best. National Indemnity shrank premiums from $366 million to $56 million between 1986 and 1998 while maintaining an underwriting profit every year until 9/11. Berkshire is again retreating as reinsurance pricing falls 20%, while holding $300 billion of the industry’s $600 billion of capital and writing premiums equal to just 7% of its own capital. A fixed GEICO runs combined ratios in the low-to-mid 80s and grew policies 5% last year. The insurance group dividended $100 billion to the parent over two years; about $120 billion of the $380 billion cash pile sits at the holding company. Then there is the new $10 billion Google purchase at 10 times sales, which lifts the position past $30 billion, now Berkshire’s third-largest equity holding. Chris’s read on what this signals about Greg Abel’s capital allocation, and the signposts he is watching, is alone worth hearing.
Hear the full session
This summary compresses a dense, data-rich session and a candid Q&A covering AI-driven job displacement, Google’s at-the-market equity offerings, housing exposure through Builders FirstSource, and the future of Berkshire’s culture. The audio replay captures the delivery and the room. The transcript preserves every number. The 54-page deck includes the secular peaks-and-troughs table, the five-factor decompositions of Coke, Apple, and the S&P 500, and the AI capex and depreciation schedules underlying the argument. All three are available now to Latticework members. If you are not yet a member, this session is a fine reason to join us.
