

We are delighted to launch Latticework Business Intelligence, a new series featuring in-depth equity research coverage. The series applies the method of our Industry Primers to a single company: a full reference report, the model behind it, and a podcast that tells the story and then works through the investment case. The aim is to help fundamental, long-term investors expand and deepen their circle of competence, one company at a time.
The first company in the series is Nike, Inc. (NYSE: NKE). Our initiation package include the in-depth initiation report, a companion slide deck, our Excel model, and two podcast episodes, the first on the story and the second a deep dive for investors. The companion deck and the first episode are free; the research report, the model, and the in-depth audio program are for members. We welcome your feedback.
Initiating coverage on Nike
We initiate coverage of Nike at Long-Term Overweight. At a fixed 10% required return we value a share at $43.99 to $51.27, with a median of $47.50, against a reference price of $31.50, Nike’s pre-market quote on October 2, 2026, after its fiscal Q1 FY2027 results. The turnaround is real in its defensive half and unproven in its offensive half, and we give it the benefit of the doubt because of what the brand is: one of only two truly global athletic mega-brands with proven long-term staying power.
Nike is in its longest slump on record. Trailing revenue peaked at $51.6 billion in fiscal Q3 FY2024 (Dec 2023–Feb 2024) and was $45.9 billion in the twelve months to August 2026, 11% lower. EBIT margin fell from 15.5% in FY2021 to 6.2% in FY2026 (the fiscal year to May 2026), excluding a one-time tariff refund. Elliott Hill, who joined Nike as an intern in 1988, returned as chief executive on October 14, 2024; on his first earnings call, on December 19, 2024, he said the company had “lost our obsession with sport.”
The value sits in the margin Nike returns to. We expect the EBIT margin to climb from 5.2% in FY2027 to 13% in FY2032, a return to Nike’s FY2008–FY2026 median of 12.9%, with revenue growing about 5% a year from FY2029, the category’s rate. Each point of steady-state margin is worth about $3.47 a share at 10%, and only terminal growth moves the value more.
The next nine months will show how much of the repair holds. Nike holds an Investor Day on November 16–17, 2026, where it is expected to set long-term targets; its partners’ online sales in China end on January 1, 2027; and the first products built from brief to shelf under Hill land in spring 2027. The first of our kill criteria that can trip, inventory, is read in late March 2027; the report dates every test.
What Q1 FY2027 revealed
The quarter settled the defense’s best-measured line and none of the offense’s. Gross margin rose 60 basis points on the year, to 42.8%, its first rise since fiscal Q1 FY2025; under the scorecard’s rule one quarter makes the line improving, not green, because green takes two. Revenue fell 5% without currency effects, the ninth quarter without growth, and Nike now guides the full year to a decline in the high single digits.
The costs Nike controls kept falling. Operating overhead fell 6%, to $2,658 million from $2,828 million a year earlier, and demand creation rose 5%, to $1,252 million, less than the high-single-digit rise Nike had guided for the World Cup quarter. Inventory fell 3% while revenue fell 4%, so stock stayed in line with sales. EBIT was $907 million, 8.1% of revenue against 7.7%, and diluted earnings per share were $0.48 against $0.49. Nike reported no tariff refund or true-up in the quarter.
The offense has yet to show up. Reported revenue fell 4%, inside the June guide of a low- to mid-single-digit decline. North America grew 2%, with wholesale up 9%, but NIKE Brand wholesale fell 1% overall and NIKE Direct fell 9%, with digital down 13%; Greater China fell 26% without currency effects as Nike cut back its online distribution there. Running grew by double digits again, while Sportswear, just under half of revenue, fell by low double digits and Jordan, 13% of revenue, by the mid-teens, as Nike cut the supply of its retro styles on purpose. Management said those actions would weigh on revenue for the rest of fiscal 2027 and into fiscal 2028. It also announced Pace, a program it expects to save about $2.5 billion through fiscal 2031, mostly in fiscal 2029 and 2030, at a cost of about $1.0 billion, and it will set out its long-term algorithm at the Investor Day in November.
What changed in our numbers. Wholesale and full price turned red on our scorecard, the first because Nike’s wholesale revenue fell again and the second because discounts rose, and gross margin stayed at improving, so the twelve lines now read four green, two improving and six red. The model’s FY2027 and FY2028 follow Nike’s new guide: about 8% less revenue in FY2027 at an EBIT margin of about 5.2%, and a slower FY2028.
Our long-term investment thesis on Nike
The turnaround is real in its defensive half and unproven in its offensive half. Nike has made most of the moves a company can make by itself, and the value of a share turns less on whether the recovery comes than on the margin it reaches and how long that takes.
The defense is well underway, and the numbers show it. Nike has removed more than $4 billion of revenue from its three classic franchises, Air Force 1, Air Jordan 1 and Dunk, which it had supplied past their demand. Its gross margin, excluding the tariff refund, fell by less in each quarter of FY2026 than in the one before: by 320, 300, 130 and finally 10 basis points year on year. Management has met or beaten its own revenue guidance in eight straight quarters, through fiscal Q1 FY2027. On our scorecard of twelve goals, five lines were green at the end of FY2026 (wholesale, inventory, the classics, running and overhead), and every green line except running is something Nike could do by itself (Part IV of the report).
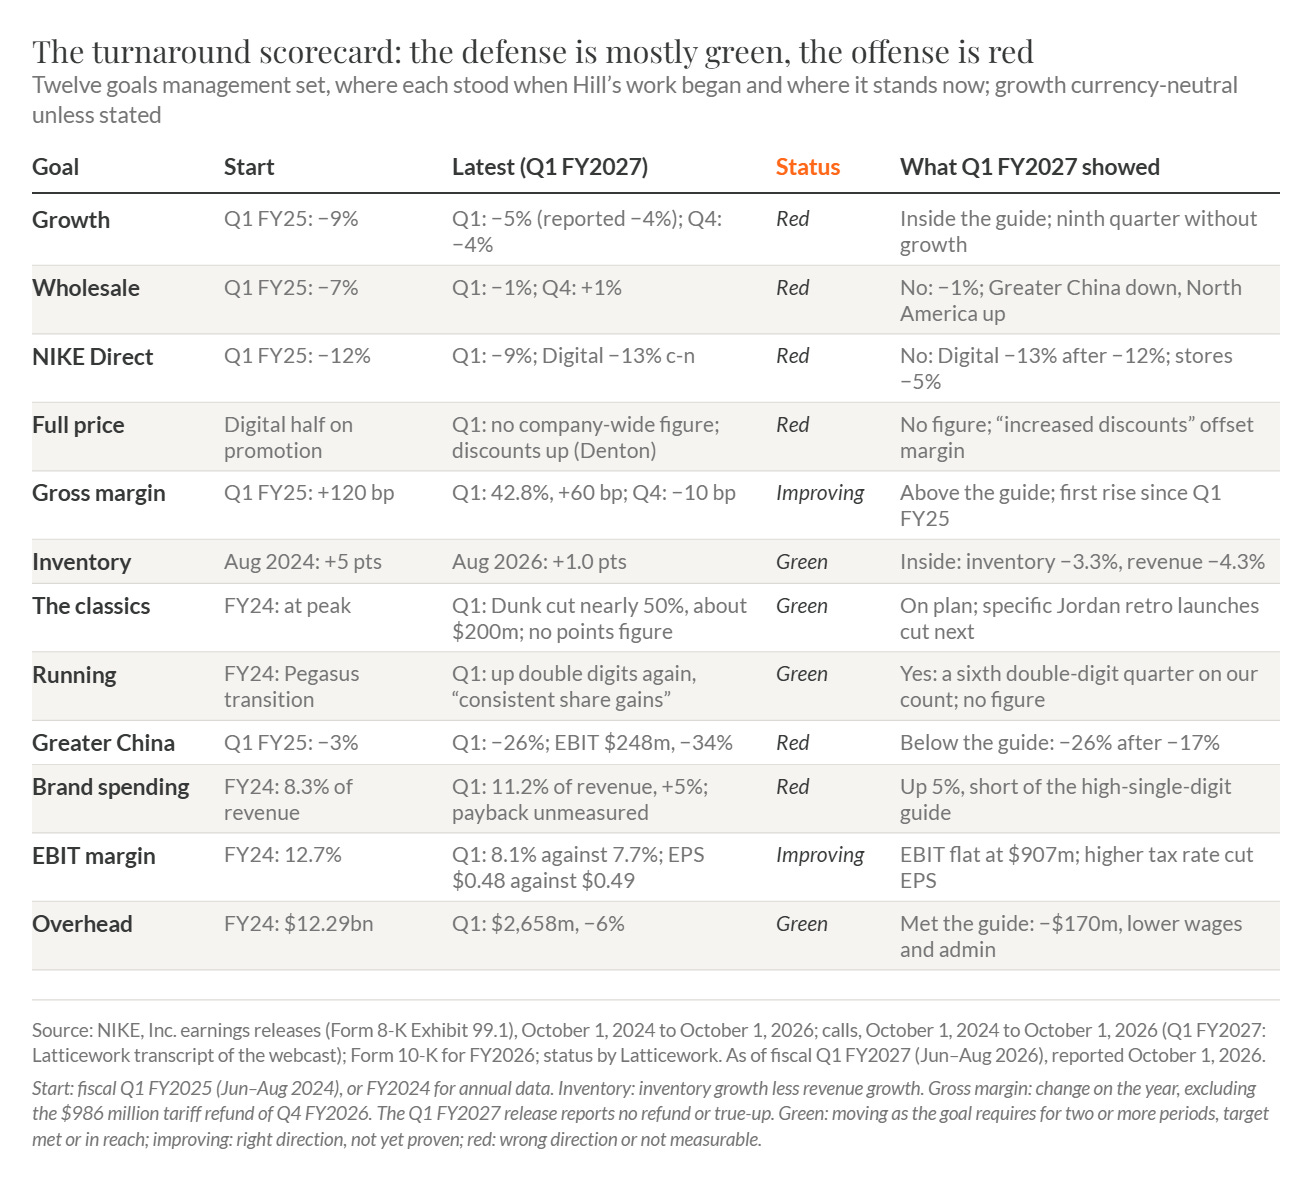
The turnaround scorecard: twelve goals management set, the metric that proves each, where it started and where it stands after fiscal Q1 FY2027 (Part IV, Chapter 16). At the end of FY2026, five lines were green, three improving and four red; after fiscal Q1 FY2027, four are green, two improving and six red.
The offense has not shown up yet. Currency-neutral revenue has not grown in any of the nine quarters from fiscal Q1 FY2025 (Jun–Aug 2024) to fiscal Q1 FY2027 (Jun–Aug 2026), when it fell 5%. Hill puts Sportswear and Jordan Streetwear at “approximately half of our revenue”, about $23 billion of FY2026’s $46.4 billion, and that half is still shrinking. A 10% decline in it removes about $2.3 billion a year, while running, Nike’s clearest success, added “roughly $1 billion” over five quarters. Greater China’s FY2026 decline of about $0.74 billion offset about four-fifths of the $0.94 billion that North America added.
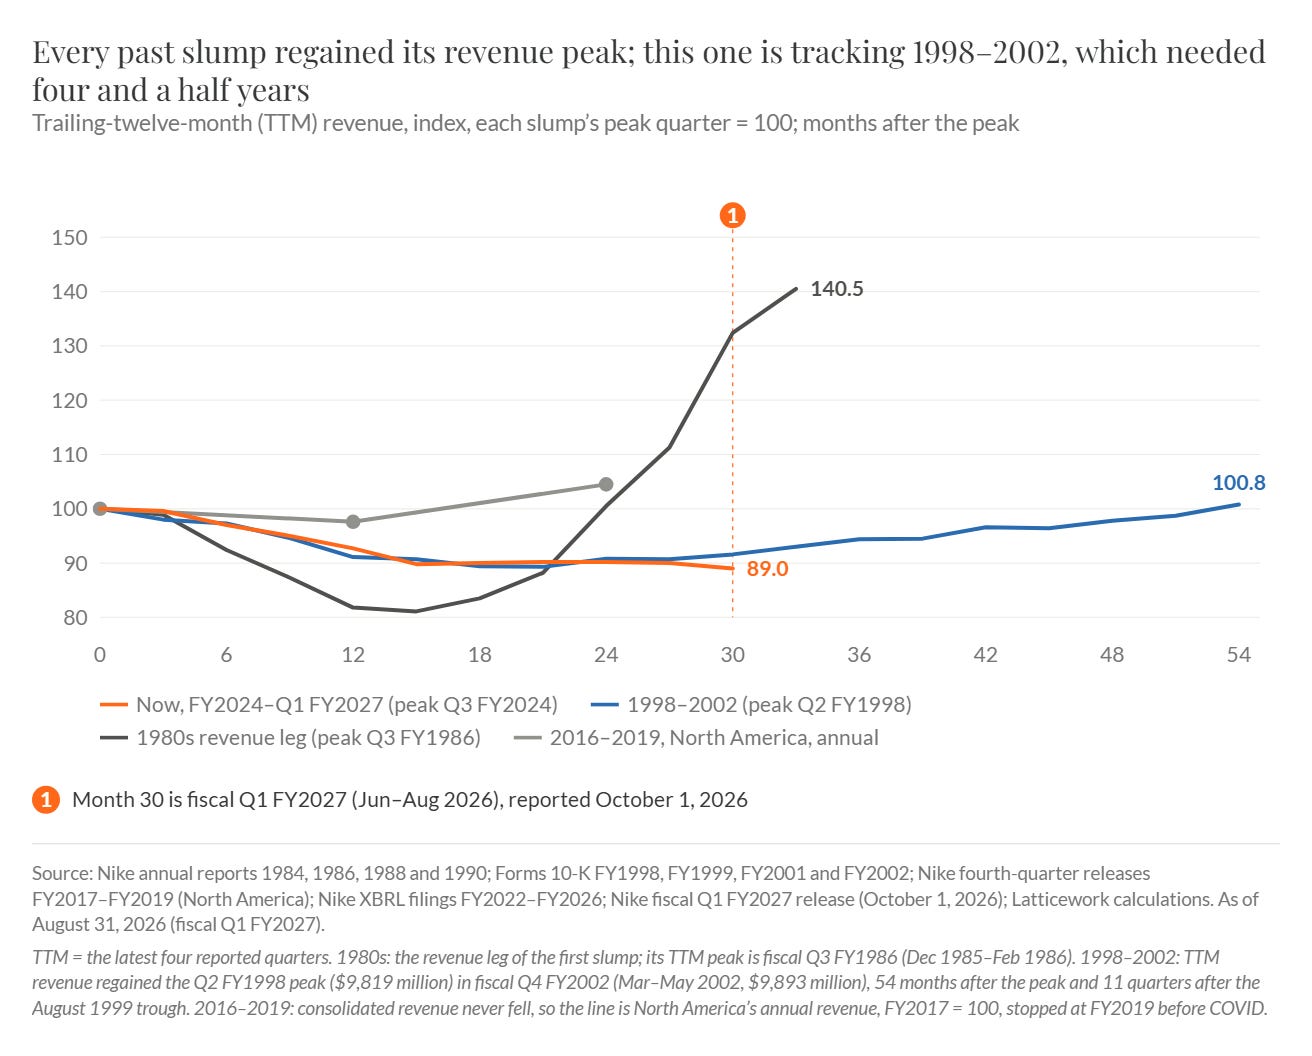
Every earlier Nike slump regained its revenue peak; this one is tracking 1998–2002, which needed four and a half years. Trailing-twelve-month revenue indexed to each slump’s peak quarter (Part I, Chapter 2).
The market kept growing while Nike lost share, and it lost share to many brands at once. The combined revenue of the twelve largest athletic brands grew from $100.2 billion in 2019 to $147.4 billion in the twelve months to mid-2026, while Nike’s share fell from 41% to 31%, and eight of the other eleven brands gained. adidas (XETRA: ADS) under Bjørn Gulden is the largest share-taker; On Holding (NYSE: ONON) and HOKA, a brand of Deckers Outdoor (NYSE: DECK), won running customers from 2019 to 2024; in Greater China the market grew while Nike’s sales there fell. Because the loss is spread across many brands, the fading of any one of them would not return it. The share series is our own, built from the twelve brands’ reports (Part III).
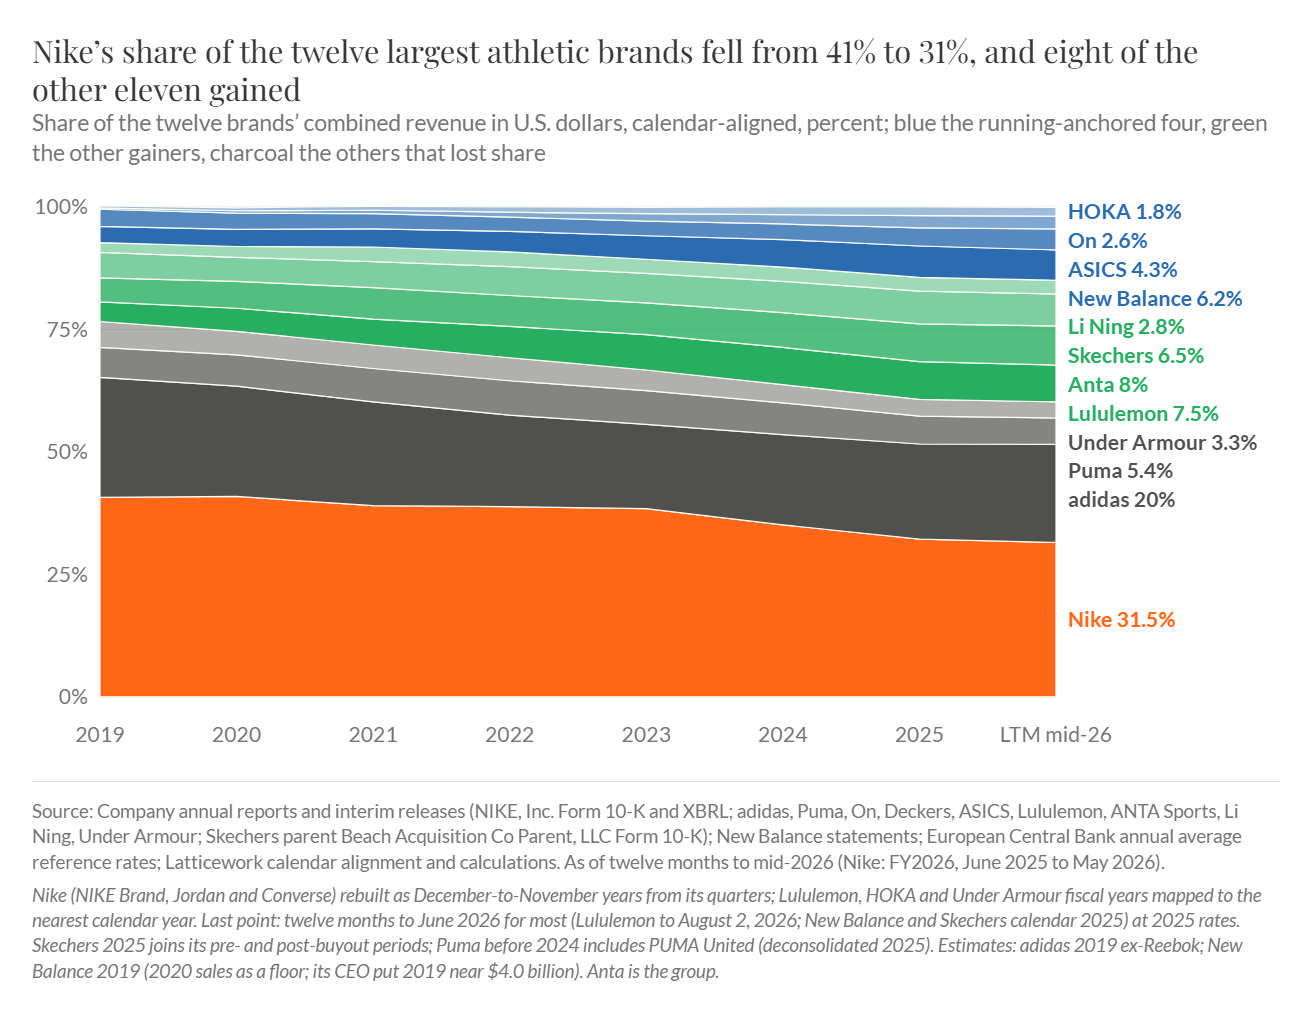
Nike’s share of the twelve largest athletic brands fell from 41% to 31% between 2019 and the twelve months to mid-2026, and eight of the other eleven gained. Share of combined revenue in U.S. dollars, calendar-aligned (Part III, Chapter 10).
The franchise’s economics survived the slump, so the question is the margin. Nike reported a return on invested capital of 18.7% for FY2026. At a flat 20% tax rate, return on capital fell from 34.6% in FY2024 to 19.3% in FY2026; about four-fifths of that fall came from margin, and the lowest reading in twenty years is still about twice a 10% hurdle. Nike’s EBIT margin had a median of 12.9% over FY2008–FY2026, and each point of margin is worth about $0.46 billion of annual EBIT on FY2026 revenue.
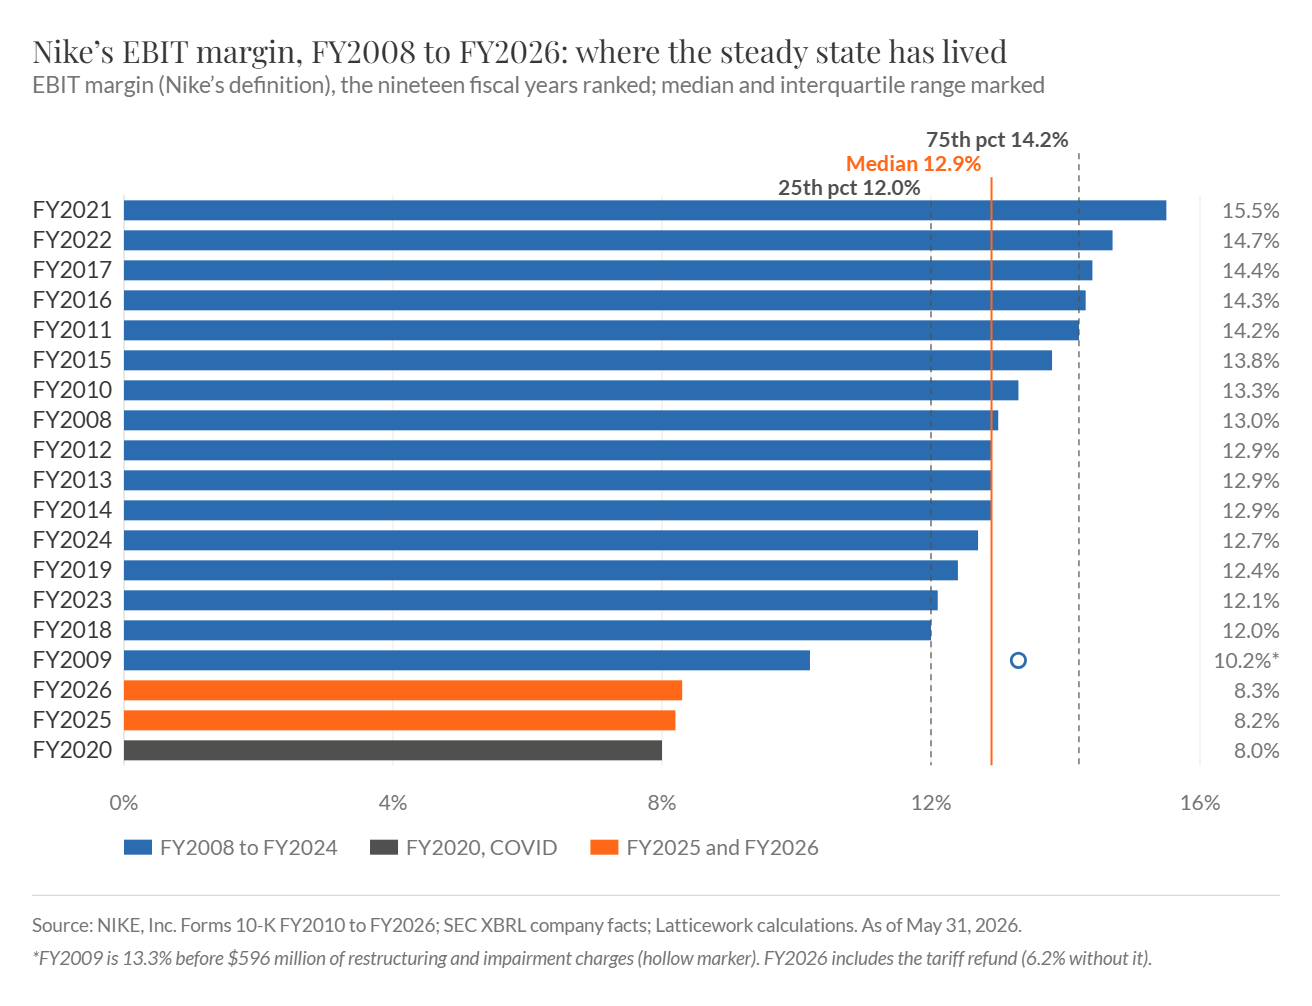
Nike’s EBIT margin, FY2008 to FY2026, with the nineteen years ranked: the median is 12.9%, with half the years between 12.0% and 14.2% (Part VII, Chapter 29). FY2020, the COVID year, and FY2025 and FY2026 are the only years below 10% in the series.
We expect Nike to return to that median. We put the margin after the recovery at 13%, within a range of 12% to 15%, reached in FY2032. Nike and adidas are the only truly global mega-brands with proven long-term staying power, and Nike keeps major aspirational appeal worldwide and the budget to keep associating itself with the world’s leading athletes. So we are more willing to give its turnaround the benefit of the doubt than we would be with, for example, lululemon’s. The record shows what stands in the way. Operating overhead is 24.5% of revenue, 1.6 points above FY2019. Tariffs are a new gross cost of about $1.5 billion a year before mitigation, and they cost more as the mix moves toward wholesale: on our model of a $100 running shoe made in Vietnam, Nike earns about $5.94 on a wholesale pair, and the duty in force since July 24, 2026 takes 46% of that before mitigation. Endorsement commitments of $15.5 billion equal 3.3 years of demand creation, against 1.6 years in 2010.
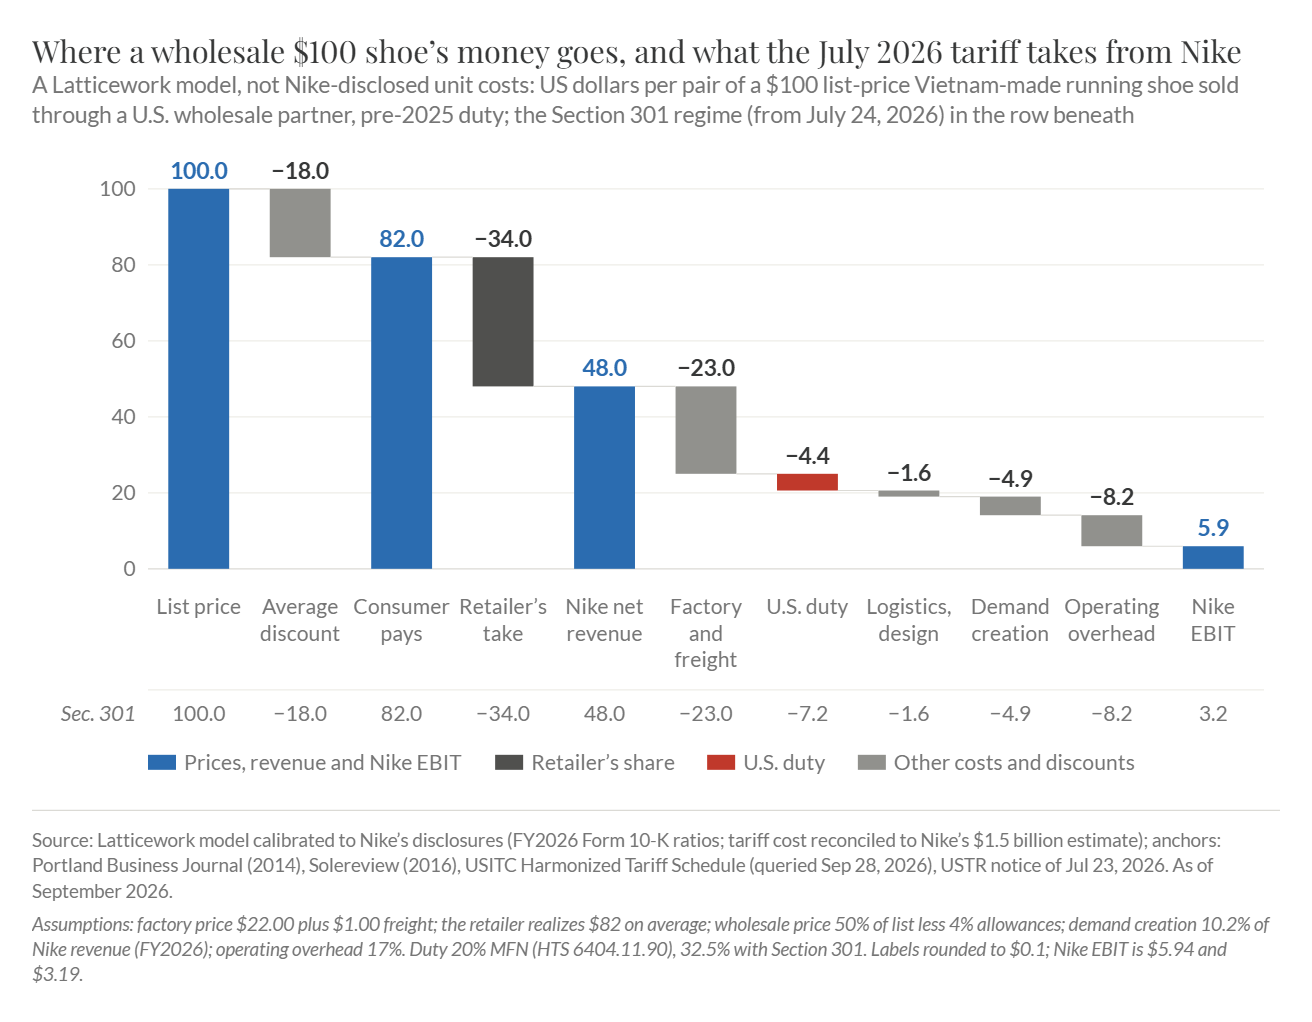
Where the money from a $100 shoe sold through a U.S. wholesale partner goes, and what the July 2026 tariff takes from Nike. A Latticework model calibrated to Nike’s disclosures, not Nike’s own unit costs (Part II, Chapter 7). Nike’s EBIT is $5.94 a pair, about 7% of the $82 the consumer pays on average.
The climb from FY2026’s 6.2%, excluding the refund, to 13% is worth about $3.2 billion of annual EBIT. We expect the margin to reach about 10% in FY2030, 11.6% in FY2031 and 13% in FY2032, with gross margin and overhead supplying almost all of the climb. The closest analog in cause, Nike’s own 1998–2003 slump, took four years from the revenue trough for gross margin to recover, and each of Nike’s three earlier slumps ended with gross and pretax margins above the prior peak. The first outside test of our estimate is the Investor Day: whatever margin Nike sets as its goal will be read against the 12.9% median and the post-FY2017 median of 12.2%.
What a Nike share is worth
At a fixed 10% required return, a Nike share is worth $43.99 to $51.27. That is the 25th to 75th percentile of 20,000 discounted cash flow runs, with a median of $47.50. The same runs give $68.60 to $86.92 at 8% and $37.16 to $42.55 at 11%. Each point of the steady-state margin adds about $3.47 to the value of a share at 10%, and of the judgments in the model only terminal growth moves the value more. With no growth at all, at a 13% margin on its average revenue of FY2022–FY2026, a share is worth $33.16 at 10%, about seven-tenths of the base case; the bear and bull cases, which move every input the same way at once, give $33.73 and $63.11.
We discount Nike’s free cash flow at a fixed 10%, the return an owner requires. We use that rate for every company in the series and put the uncertainty in the cash flows instead: growth, the steady-state margin and the years to reach it, reinvestment and terminal growth are each drawn from a range, 20,000 times, over a forecast that runs to FY2036. Growth of 5% a year in FY2029–FY2031 matches the category’s growth of about 5% a year; Nike’s own record is 5.7% a year over FY2007–FY2026 and 3.7% over FY2016–FY2026. Terminal growth of 5% is the category’s long-run growth with Nike holding its share, which puts it above long-run nominal GDP growth. And 10% is a demanding hurdle for a market-leading franchise, which is why the sensitivities run down to 8% and only up to 11%. The valuation sheets hold no market data; those sit on a separate sheet that the valuation does not read. Then we set the range beside the market: what the Branded Athletic Leaders (adidas, ASICS, Deckers, On and Amer Sports) trade for, what acquirers have paid for comparable brands, and the reference price. For the peer comparison we follow each company’s own disclosure of one-time items. We set no price target.
Our rating is Long-Term Overweight against the S&P 500. The reference price is $31.50, Nike’s pre-market quote on October 2, 2026, after the fiscal Q1 FY2027 release. At that price the shares sit 33.7% below the $47.50 median and below our whole 10% range. If the gap to the median closes over four years, an owner can expect about 21.9% a year, against about 7.5% a year for the index on our assumptions: a difference of 14.44 points a year against the 2-point line. The rating holds if the gap closes over three or five years, and on a gross rather than net measure of the index’s buybacks. It would turn Long-Term Neutral only at a price above about $48.44, or at a median value below about $30.89.
About this rating. Nike, Inc. (NKE) is rated Long-Term Overweight against the S&P 500 total return in U.S. dollars. Long-Term Overweight means we expect Nike’s shares to beat the index by more than 2 percentage points a year over the next three to five years; Long-Term Neutral, within 2 points either way; Long-Term Underweight, more than 2 points behind. Reference price: $31.50, Interactive Brokers pre-market quote, 5:13 a.m. ET (11:13 a.m. Zurich time), October 2, 2026, after the fiscal Q1 FY2027 release. We set no price target. First published October 2, 2026. By John Mihaljevic, Founder of MOI Global, publishing as Latticework by MOI Global. Holdings in Nike: none. Not paid for by Nike or shown to Nike before publication. We publish a note after each quarterly result. This is impersonal research, not personal advice. The method, sensitivities and full disclosures are in Appendix F of the report, free at https://www.latticework.com/p/disclosures.
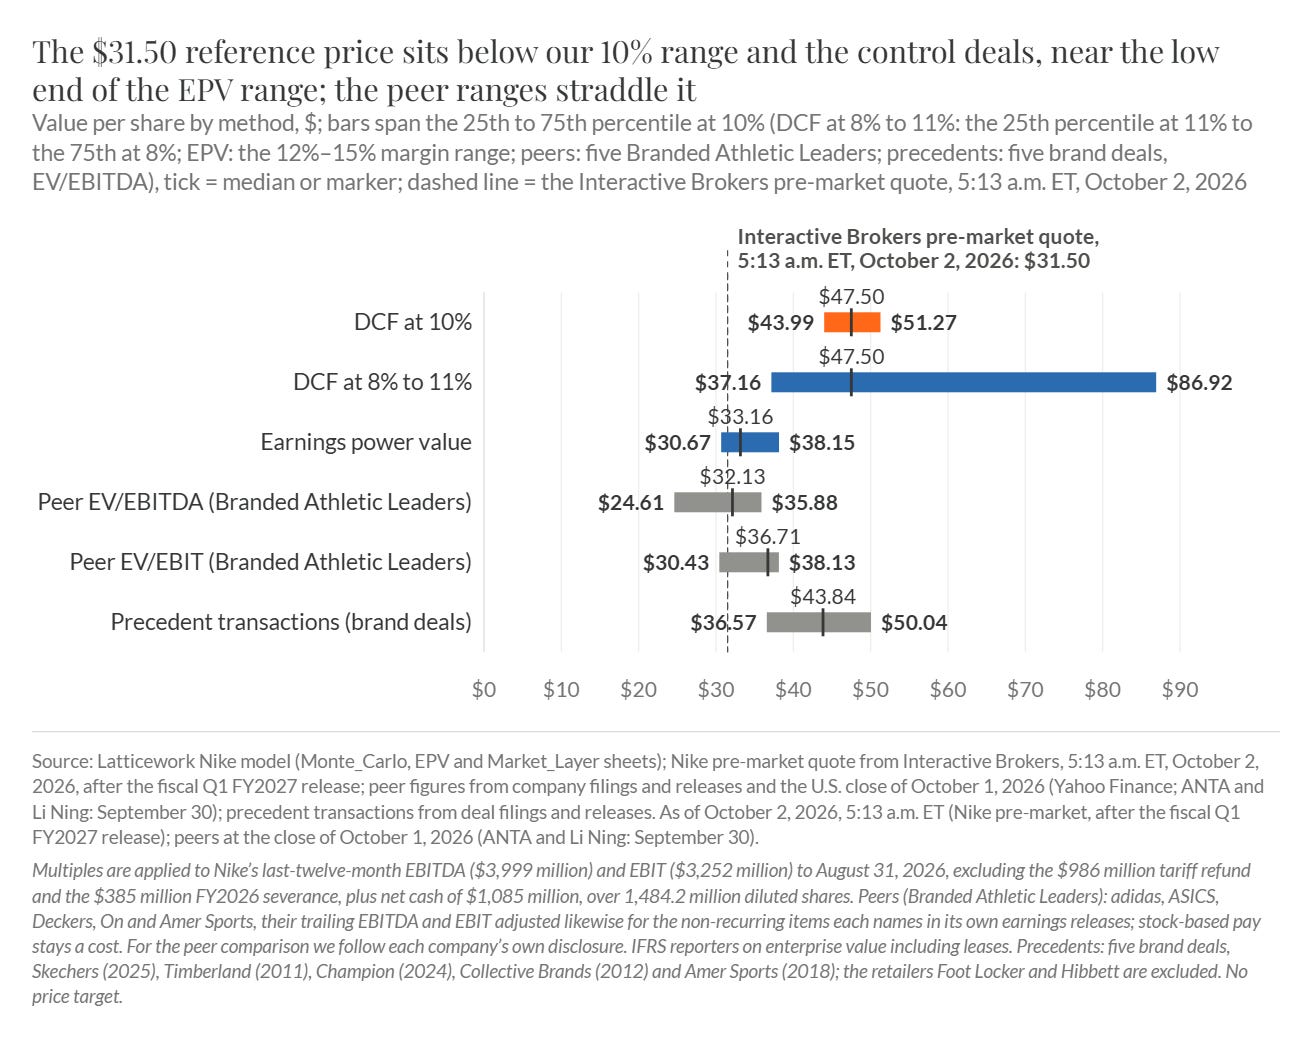
Every method on one scale, with the $31.50 reference price as a dashed line: it sits below our 10% range and the control deals, near the low end of the earnings-power range, and the peer-multiple ranges straddle it (Part X, Chapter 37).
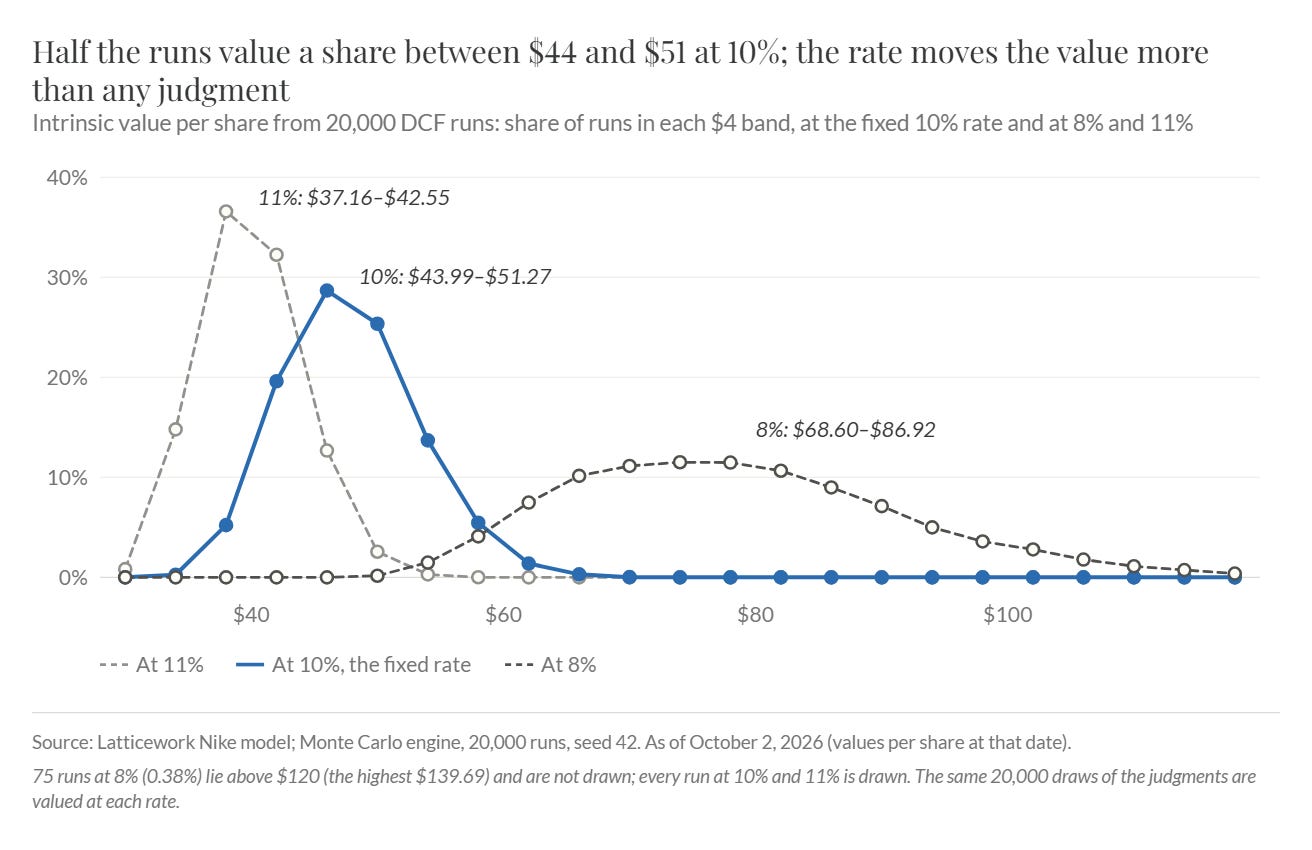
The value of a Nike share across 20,000 runs of the discounted cash flow, at the fixed 10% rate and at 8% and 11% (Part X, Chapter 36). Half the runs fall between $43.99 and $51.27 at 10%; the rate moves the value more than any judgment.
What’s part of the initiation package
The companion deck. A self-contained summary of the report in slide form, free to every reader.
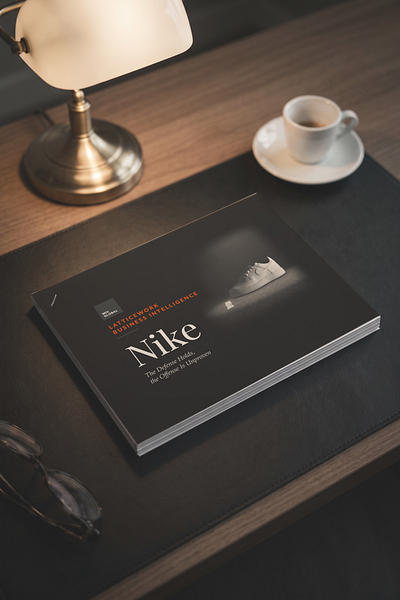
MEMBERS ONLY: The coverage initiation report. Nike, Inc. (NYSE: NKE): the full initiation, with an executive summary and the six debates at the front, then Nike’s history, business model, competition, turnaround, brand health, regions, financial record, governance, forecasts, valuation, risks and a monitoring dashboard.
MEMBERS ONLY: The model. The Excel workbook behind the forecasts and the valuation: the revenue build by segment to FY2031 and revenue, margins and tax to FY2036, free cash flow and the share count, the discounted cash flow at 8%, 10% and 11%, the earnings power cross-check, and the Monte Carlo inputs and results. A reader can change any assumption and watch the discounted cash flow value move.
Podcast, Part One: The Story. About 90 minutes on how a running-shoe distributor called Blue Ribbon Sports became Nike, the five chief executives and three earlier slumps, and Elliott Hill’s return. It assumes no knowledge of the company. Listen to Part One: The Story
MEMBERS ONLY: Podcast, Part Two: The Deep Dive for Investors. About two and a half hours on the business model, the economics of a $100 shoe, the competition, the turnaround scorecard, the financial record, the valuation and the risks, for listeners who want the investment case in full. Listen to Part Two: The Deep Dive
The coverage continues after publication. Part XIII of the report sets out ten numbers, each with a threshold and a date, and Latticework will publish a note after each quarterly report and after the Investor Day, revaluing only when the evidence moves an input outside its range. The first of those tests that can trip is inventory, in late March 2027 at the earliest. Please reply with what was useful, what was missing, any errors you find, and the companies you would like us to cover next; member requests inform the order of coverage.
This post is an investment recommendation; the rating, its meaning, the reference price and our conflicts are stated above, and the full disclosures (Appendix F of the report) are free at https://www.latticework.com/p/disclosures. Impersonal research, not personal investment advice.