

Lennar has changed how it builds and how it holds land. It builds a house in 116 days, about half the time it took in early 2023, and it owns fewer than one in forty of the 487,961 homesites it counts, a land position nearly as light as that of NVR, Inc. (NYSE: NVR). It paid for both with its gross margin on home sales, which fell from 27.5% in FY2022 to 15.8% in Q3 FY2026 (Jun-Aug 2026), below the line of about 17% at which the business earns its cost of capital. On the call of September 17, 2026, Stuart Miller, its executive chairman, chief executive and president, put the whole margin gap on land: “It’s not labor. It’s not materials. It’s not overhead. It is land.”
This is the second issue of Latticework Business Intelligence, the series of in-depth coverage initiations from Latticework by MOI Global, and it covers Lennar Corporation (NYSE: LEN), the second-largest U.S. homebuilder by deliveries. As with Nike, we are releasing the whole package at once so that each reader can choose where to start: the report, the Excel model, our transcripts of eighteen Lennar earnings calls, a companion slide deck, and two podcast episodes, the first on the story and the second a deep dive for investors. The companion deck and the first episode are free; the report, the model, the transcripts and the second episode are for members. We welcome your feedback on all of it.
This initiation builds on our Industry Primer on Homebuilding.
Scroll down for the free-to-read summary slide deck on Lennar.
Initiating coverage on Lennar
We initiate coverage of Lennar’s Class A shares (LEN) at Long-Term Overweight against the S&P 500 over three to five years. The Class B shares (LEN.B) are not separately rated.
The operating improvements are real; the margin picture has yet to reflect them. At a fixed 10% required return we value a Lennar share at $112.93 to $148.86, with a median of $130.67, one value for a Class A share (LEN) or a Class B share (LEN.B), against a reference price of $74.92, the NYSE official close of the Class A shares on October 13, 2026.
The question is whether Lennar earns its cost of capital through a full cycle: not at its FY2026 margin, though on average it did from FY2012 to FY2025, after the bust. The cost of capital is our fixed 10% after tax, the hurdle we apply to every company we cover. Over FY2006 to FY2025, the bust included, Lennar’s return on equity averaged 7.0%, against 15.2% over FY2012 to FY2025, and the years since the Millrose spin-off fall short of 10%. The line is a reported gross margin on home sales of about 17%: FY2025’s 17.7% met it, and the first nine months of FY2026 (Dec 2025-Aug 2026), at 15.5%, fell short of it.
The value turns on incentives, land carry and the next downturn, far more than on further cuts in the cost of building a house. In FY2026 incentives eased, but lower base prices and higher land costs, partly option fees in the cost of homes sold, absorbed the gain. Our base case recovers the gross margin through falling incentives alone and gives Lennar no further credit for lower building costs. With selling and corporate costs easing back, the model’s EBIT margin climbs from 5.6% of total revenues in FY2026 to a steady state of 12.3% from FY2031, and each point of that margin is worth $10.62 a share at 10%. That recovery is what our title means by temporary: it is our view, not a finding, and the five risks we monitor, below, name the readings that would prove it wrong.
Management keeps its word on what it controls, and investors such as Berkshire Hathaway and Greenhaven are co-owners beside the Miller family. Lennar now builds a house in 116 days, against about 220 in early 2023, at about $80 a square foot, 14% below its Q4 FY2023 cost. On our scorecard, its method fixed before any commitment was scored, management is calibrated over ten years and 456 commitments, neither underpromising nor overpromising: Financial Services earnings and the average sales price kept their guides or beat them, and Lennar evaded only one question in 197 on its calls. Deliveries and, since FY2022, the gross margin are where it has fallen short, with 10 of the 24 margin guides given since then missed. Stuart Miller has led Lennar since 1997, with a new operating bench below him, and eight of the nine directors are independent. Berkshire Hathaway Inc. (NYSE: BRK.A, BRK.B) has reported as a 10% holder since September 2026 and kept buying through October 2; by its Form 4 of October 5 it held about 12.2% of all shares and 6.7% of the votes, more shares than Miller. Greenhaven Associates, Ed Wachenheim’s firm, reported 5.08% of the Class A shares in May 2026 and held more by June 30; at Latticework 2025 he set out his case for Lennar. Both file as passive holders; we see informed outside co-owners as a plus for governance.
The first readings arrive by mid-December. D.R. Horton’s FY2026 results, due on October 29, 2026, are the cleanest outside check on how much of Lennar’s margin gap is choice and how much is land carry. Lennar’s own Q4 FY2026 (Sep-Nov 2026) report, due in mid-December, sets the cost ratio, the cost of homes sold over the price before incentives, against Q3’s 0.741.
What Q3 FY2026 told us
The quarter confirmed the gains in building speed and cost. Lennar’s fiscal year ends November 30, and the 10-Q for the quarter came on October 2. Deliveries of 20,840 landed inside the guided range, and cycle time set a record of 116 days. New orders of 20,879 fell below the guided 21,000 to 22,000, the first shortfall since Q4 FY2024. The new-order price fell $18,000 in a quarter, to $359,000, below the backlog’s $376,000, so prices in the order book are still falling.
Incentives eased, but a higher cost ratio absorbed the gain. Incentives fell for a third straight quarter, to 12.0% of the price before incentives, $51,000 a home. The gross margin on home sales rose only 0.2 points, to 15.8%. The cost ratio rose from 0.735 to 0.741, according to the 10-Q: “Land costs per home, reflected in part through option maintenance fees associated with extended deal durations, have increased”. The East shows what the relief looks like when it reaches the margin: incentives there fell about 6 points in a year, and the margin rose 2.3 points, to 20.9%.
The pipeline shrank while deposits and impairment indicators rose. About 86% of the quarter’s deliveries came from land banks. Non-refundable option deposits and pre-acquisition costs reached $7.24 billion, $15,197 per controlled homesite, up 19.7% in nine months while controlled homesites fell. Communities flagged for impairment rose 63% in a year, to 184 of 1,713. Lennar wrote down 38 communities by $100.0 million in nine months, against $25.6 million a year earlier.
The Q4 guide implies the first annual fall in deliveries since 2011. Lennar’s outlook for FY2026 is 80,000 to 81,000 deliveries, after fourteen years of rises. Its margin guide for Q4, 15.5% to 16.0%, implies about 15.6% for the year, the lowest full-year gross margin since 2009. Lennar set the guide before the 30-year fixed mortgage rate in Freddie Mac’s survey rose to 7.28% on October 1 and 7.40% on October 8, the highest since late 2023.
Our long-term investment thesis on Lennar
We take a side in each of the five debates: Lennar builds for less than it did, incentives are falling, and land options cost a little less than owning at 10%. The debates test one design. Starts held at the pace of sales lower the cost of building; cheaper and faster construction lets Lennar take homesites from its land banks as it needs them; the land banks, whose fees run with time, need construction to keep moving; and when demand softens, price absorbs the difference so that construction does not stop. FY2026 shows strain at three links of that loop.
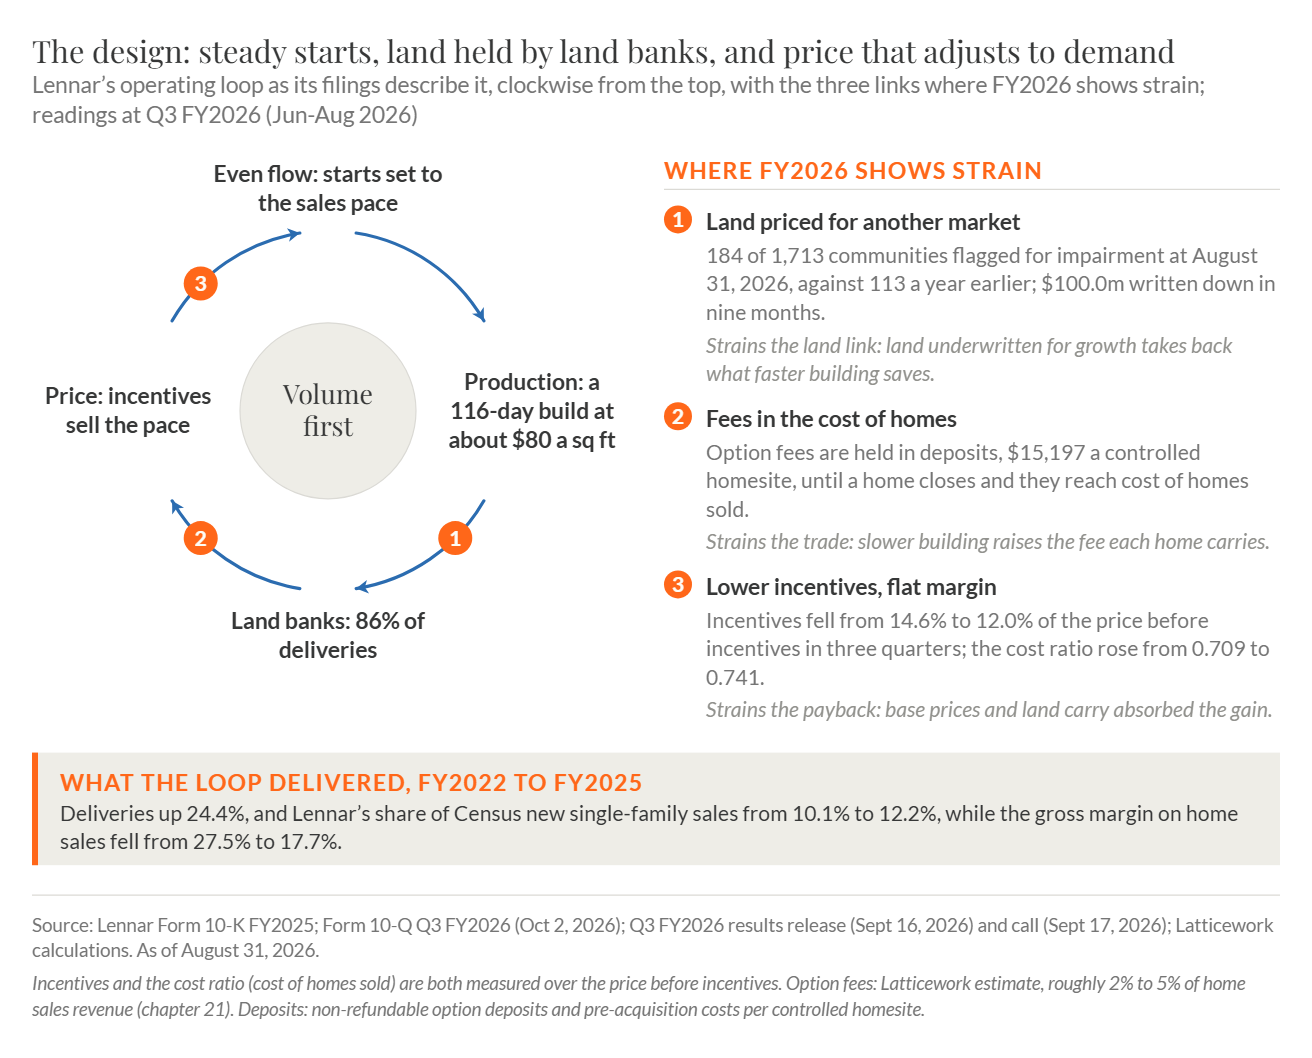
Lennar’s operating loop as its filings describe it, with readings at Q3 FY2026 and the three links where FY2026 shows strain: land priced for another market, option fees in the cost of homes sold and lower incentives that did not lift the margin (Part I, Chapter 1).
Volume over margin won share; incentives, its main cost, are falling, but land-bank fees make it hard to refocus on margin. Rick Beckwitt, then chief executive, told the call of January 9, 2019 that Lennar’s “intent is to build and deliver more than 50,000 homes this year, even if it’s at the expense of some margin”, and the rule won share: Lennar’s deliveries went from 10.1% of Census new single-family sales in FY2022 to 12.2% in FY2025. Incentives did most of the damage through FY2025, 8.4 of the 13.7 points the margin lost from its Q2 FY2022 (Mar-May 2022) peak to Q3 FY2026. In FY2026 the parts traded places: incentives fell 2.6 points while the cost ratio rose 3.2 points, as base prices fell and land carry rose. Incentives have moved against the mortgage rate since the start of FY2023, so lower rates alone will not restore the margin. The builders that held price kept more of it: from FY2022 to FY2025 Lennar’s gross margin fell 9.8 points and PulteGroup’s 3.8. About 86% of Lennar’s deliveries now come from land banks whose fees accrue with time, so selling more slowly to protect price would raise the cost of every optioned homesite.
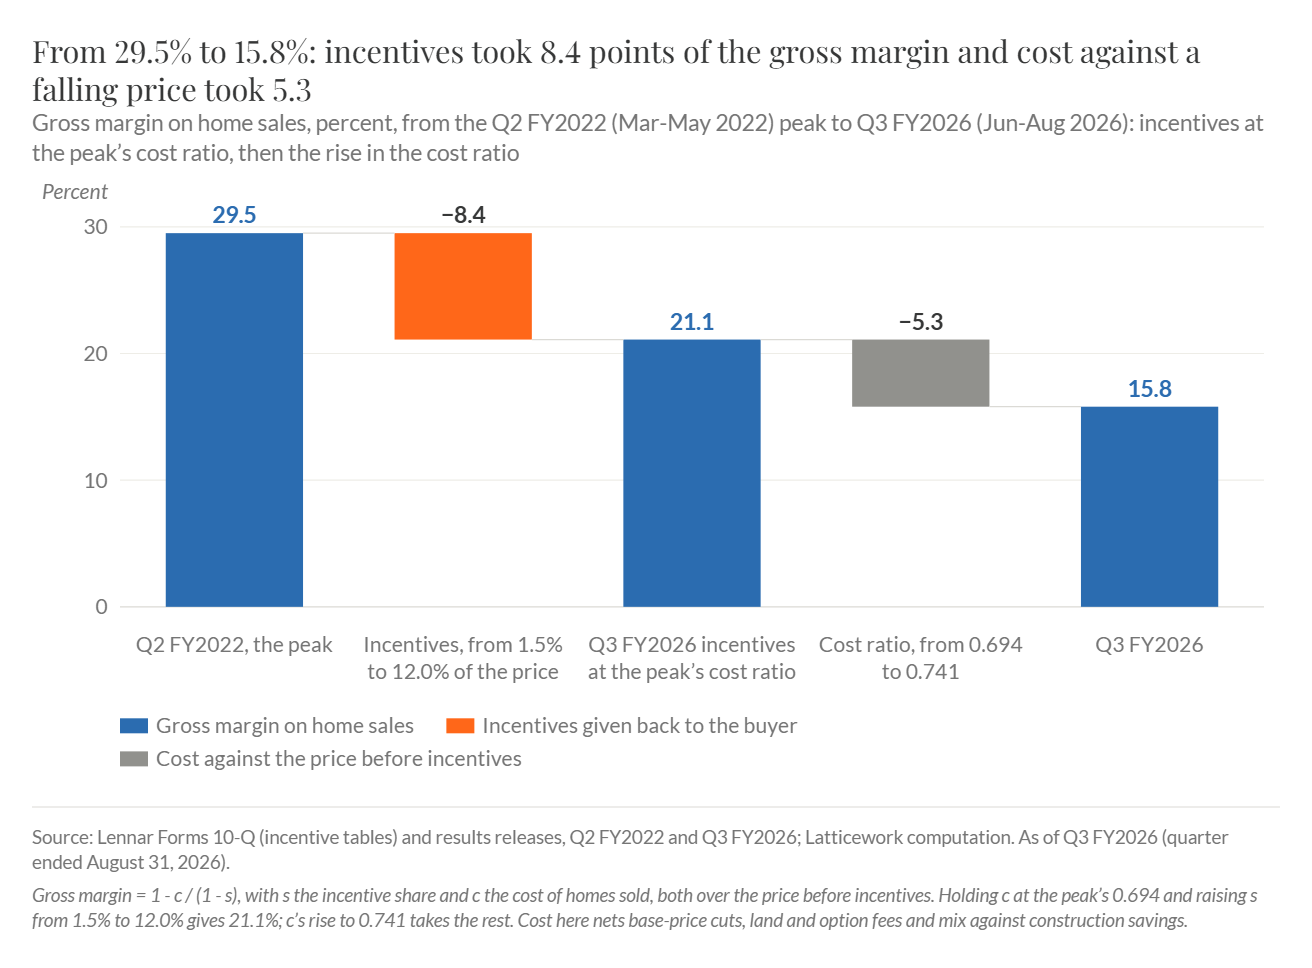
The gross margin on home sales fell from 29.5% at its Q2 FY2022 peak to 15.8% in Q3 FY2026. Incentives took 8.4 points at the peak’s cost ratio, and the rise in the cost ratio took 5.3 (Part I, Chapter 1).
Land-light and Millrose: optioning land protects Lennar in a deep bust and, after tax, costs a little less than owning it at 10%. The option model is the right answer to 2007: per homesite held at November 30, 2006, owned land lost about 6.7 times what the options lost in deposits. Worked through on the figures of Millrose Properties, Inc. (NYSE: MRP), Lennar’s largest land bank, an optioned homesite costs about 20% more than its takedown price; after tax, that is a little less than owning it would cost at 10%. The costs are real. The option fees run through the cost of homes sold, at roughly 2% to 5% of home sales revenue, and leaving is expensive: a terminated Millrose property owes a further 5% of its unpurchased takedown price, Millrose may then end the whole pool, and Lennar guarantees the payments within caps set pool by pool. Deposits per controlled homesite, at $15,197, now exceed the $14,363 a homesite Lennar forfeited on the options it left in FY2007, and Millrose, a related party, took 88% of its 2025 option fees from Lennar and its related ventures (85% from the Lennar program alone).
The production system has delivered results on speed and construction cost; the sales system has yet to deliver. Cycle time fell from about 220 days in Q1 FY2023 (Dec 2022-Feb 2023) to a record 116. Construction cost fell to about $80 a square foot, 14% below Lennar’s Q4 FY2023 baseline. Selling cost did not follow: in FY2025 Lennar spent about $32,600 of SG&A on each home, against $30,900 at D.R. Horton. After the gross margin and SG&A, Lennar kept $36,500 a home and D.R. Horton $49,600, at a lower price. No other large builder publishes a cycle time or a construction cost per square foot, so Lennar’s edge in building cannot be measured against the largest rival.
Returns through the cycle: above 10% on average from FY2012 to FY2025, below it with the bust and since the Millrose spin-off. From FY2012 to FY2025 Lennar’s return on equity averaged 15.2%; with the bust, FY2006 to FY2025, it averaged 7.0%, and an owner from peak to peak, FY2006 to FY2019, earned about 3%. Since the Millrose spin-off, return on equity was 8.3% in FY2025 and 5.0% annualized in the first nine months of FY2026. Options shrink a deep bust’s charge, since Lennar’s maximum recourse to joint-venture debt fell from $1,764.4 million in FY2006 to $30.1 million in FY2025. The bust’s cash cushion will not repeat, though: three tax refunds of about $1.42 billion carried Lennar through 2008 to 2010, and current federal law allows no carryback of a homebuilder’s operating losses arising after 2020.
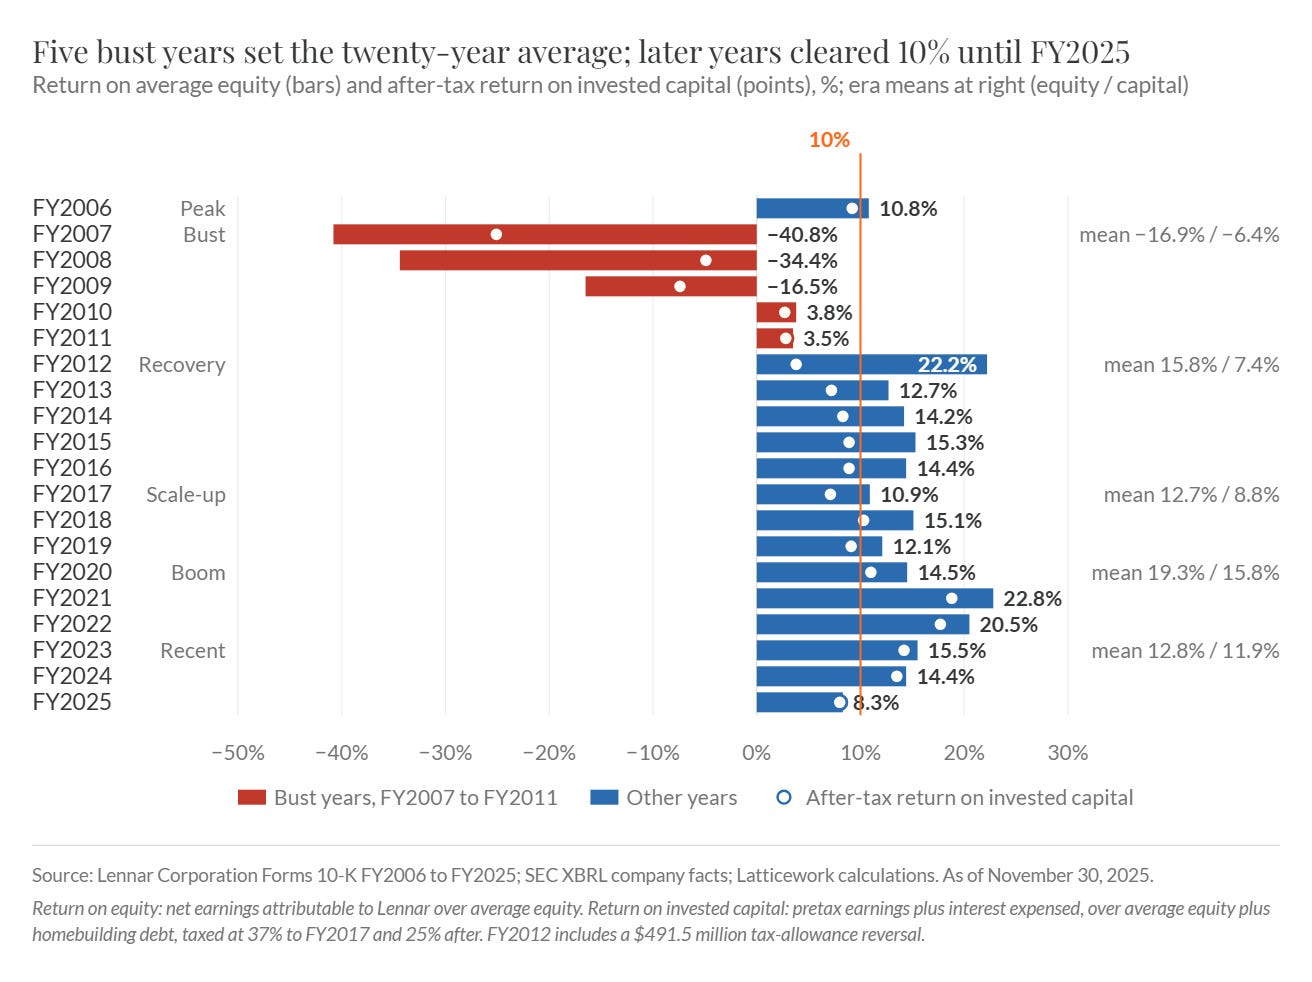
Lennar’s return on average equity and its after-tax return on invested capital, FY2006 to FY2025: five bust years set the twenty-year average, and the later years cleared 10% until FY2025 (Part X, Chapter 35).
Stewardship and control: every share is equal in money, and the questions to watch are Millrose’s terms, succession and debt-funded buybacks. The family’s items are small, reimbursed or disclosed, and under the charter dividends, distributions, liquidation and a sale go share for share. Stuart Miller could cast about 43.5% of the votes at the August 2026 count on about 10% of the shares, his share rises with every Class A share the company buys back, and since June 2026 he has held all three top titles, with no successor named. He also casts 43.2% of the votes at Millrose, an interest Lennar’s Class A holders do not share. Capital returned has exceeded operating cash flow since FY2024: buybacks and dividends of $6.49 billion against $1.80 billion of operating cash flow through the first nine months of FY2026, while homebuilding debt rose $2.04 billion from its November 2024 low.
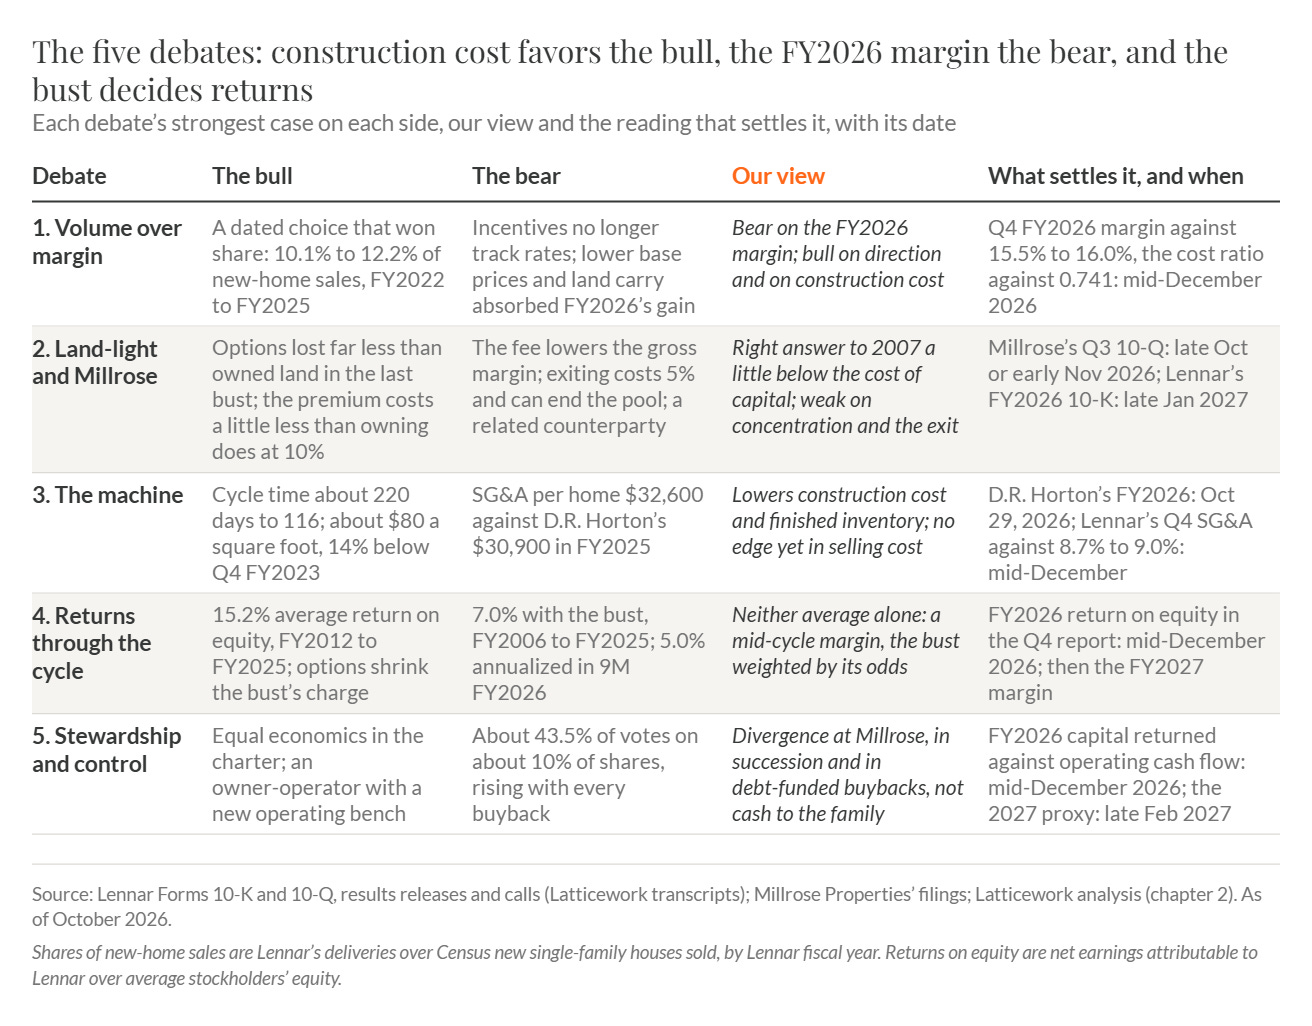
The five debates side by side: the strongest case on each side, the side we take and the reading that settles each, with its date (Part I, Chapter 2).
What a Lennar share is worth
At a fixed 10% required return, a Lennar share is worth $112.93 to $148.86, Class A or Class B alike. That is the 25th to 75th percentile of 20,000 discounted cash flow runs, with a median of $130.67. The same runs give $159.05 to $213.41 at 8% and $98.63 to $129.17 at 11%. Of the judgments the simulation draws, the steady-state margin moves the value most, by $45.37 a share between its 10th and 90th percentiles. With no growth at all, the mid-cycle business is worth $139.89 a share at 10%. The bear and bull cases give $84.68 and $192.43 and differ mainly in where incentives settle.
We discount Lennar’s free cash flow at a fixed 10%, the return an owner requires and the rate we use for every company in the series, with 8% and 11% beside it. The forecast runs in full to FY2031, free cash flow to FY2036 and a terminal value after it, and the range is the 25th to 75th percentile of a simulation that draws the judgments that decide the value: the steady-state margin, the years to reach it, growth, the capital growth needs and terminal growth. One value serves both classes, because the charter gives them equal rights to dividends, distributions and liquidation; they differ only in votes. Our models are built by AI research agents working without access to the share price. The person responsible reviews them and sets the final assumptions before publication. The valuation sheets hold no market data; those sit on a separate sheet that the valuation does not read. Then we set the range beside the market: what six large U.S. homebuilders trade for (D.R. Horton, PulteGroup, Toll Brothers, NVR, Meritage Homes and KB Home), what acquirers have paid for homebuilders, and the reference price, the Class A shares’ official close on October 13, 2026 (4:00 p.m. ET). Each peer’s earnings are adjusted for the one-time items it names, as Lennar’s are. We set no price target.
The range leaves out part of what a deep bust would cost. The simulation carries a downturn as a delay to the margin’s recovery, weighted by its odds: a correction, given a weight of 30%, delays the steady margin three years, and a deep bust, given 10%, delays it five. Each year of delay costs $2.79 a share. As built, the model takes nothing off for the busts beyond its forecast, so the range sits higher than a full-cycle owner should expect. The review of the valuation kept it that way; Chapter 45 shows what a through-cycle factor would take off.
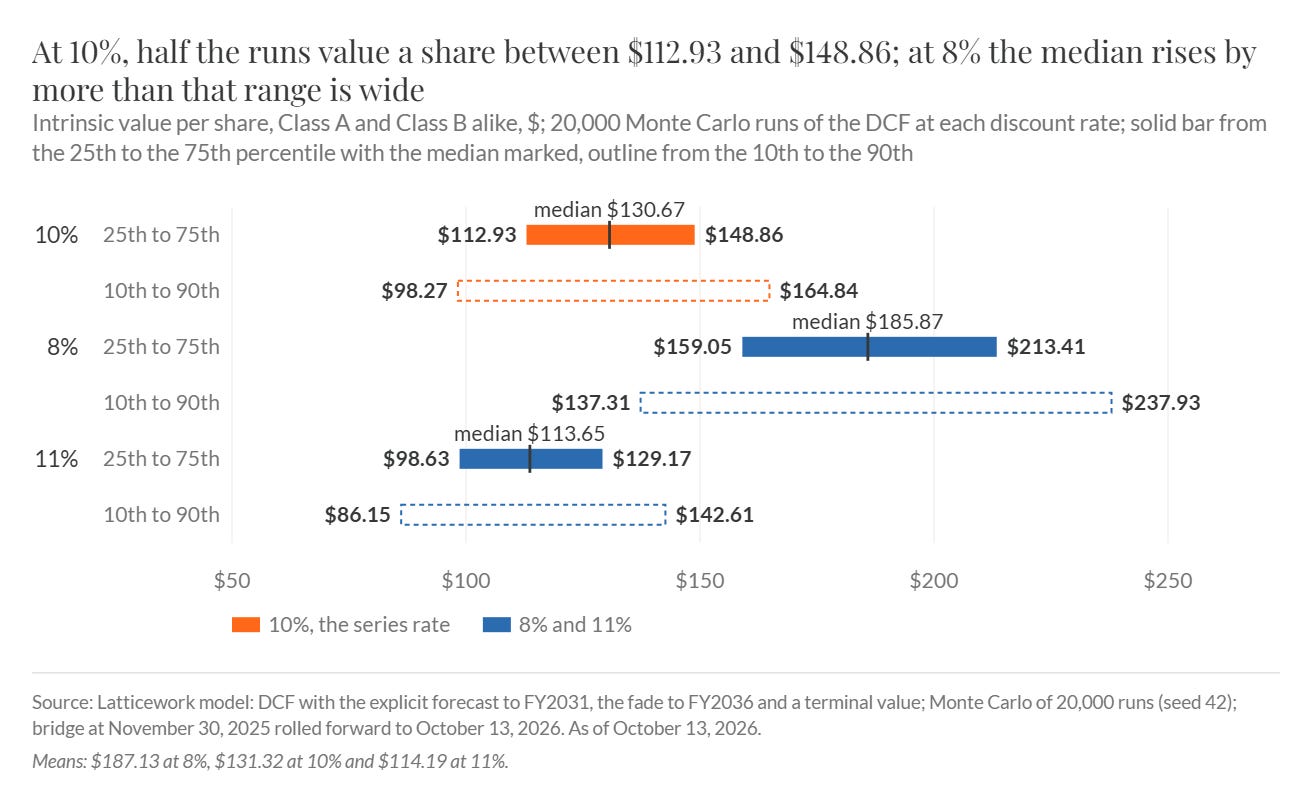
The value of a Lennar share across 20,000 runs of the discounted cash flow at the fixed 10% and at 8% and 11% (Part XII, Chapter 44): half the runs at 10% fall between $112.93 and $148.86, and the rate moves the value more than any judgment.
We monitor five risks to our thesis, our “kill criteria”, to gauge whether the investment case remains on track. The margin would fail it through a gross margin on home sales below 15.5%, the bottom of Lennar’s Q4 guide, for four quarters while deliveries fall, a cost ratio above 0.750 for four quarters, or SG&A per home rising year over year four quarters running while volume holds. The land would fail it through write-offs above 5% of non-refundable deposits over four quarters, or through Millrose’s terms: a termination, a Prepayment call or a new pool priced above 8.5%. The cash would fail it through homebuilding debt above 20% of total capital, or buybacks funded with debt over a year. Each threshold is our judgment, set at the review of the valuation, of the reading at which the base case would stop describing Lennar. Two are short-term items to watch: the write-offs, whose cash-flow add-back reached $223.9 million in the first nine months of FY2026, 1.04% of home sales revenue and the highest share since FY2011, and the cash, as operations used $822 million over the same months while Lennar returned $1,359 million in buybacks and dividends.
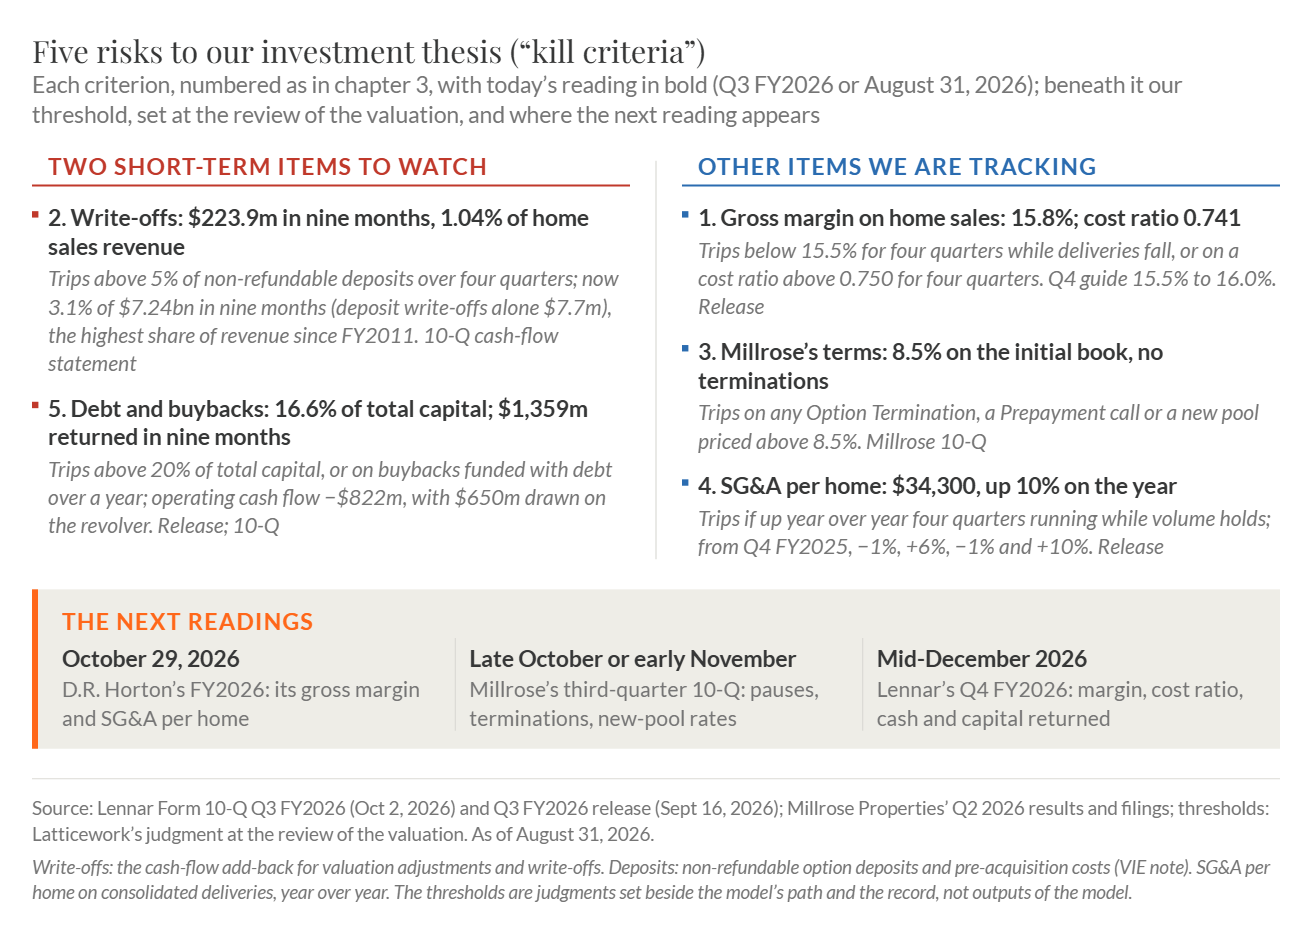
Five risks to our investment thesis (our “kill criteria”), each with its reading at August 31, 2026, our threshold and where the next reading appears (Part I, Chapter 3).
Our rating is Long-Term Overweight against the S&P 500. The reference price is $74.92, the NYSE official close of Lennar’s Class A shares on October 13, 2026; the Class B shares are not separately rated. At that price the shares sit 42.7% below the $130.67 median and below the whole range at each of the three rates. If the gap to the median closes over four years, an owner can expect about 26.4% a year, against about 7.4% a year for the index on our assumptions: a difference of 19.00 points a year against the 2-point line. The rating holds if the gap closes over three or five years, at about 32.4% and 22.9% a year, and on a gross rather than net measure of the index’s buybacks. It would turn Long-Term Neutral only at a price above about $133.51, or at a median value below about $73.33 (Chapter 46).
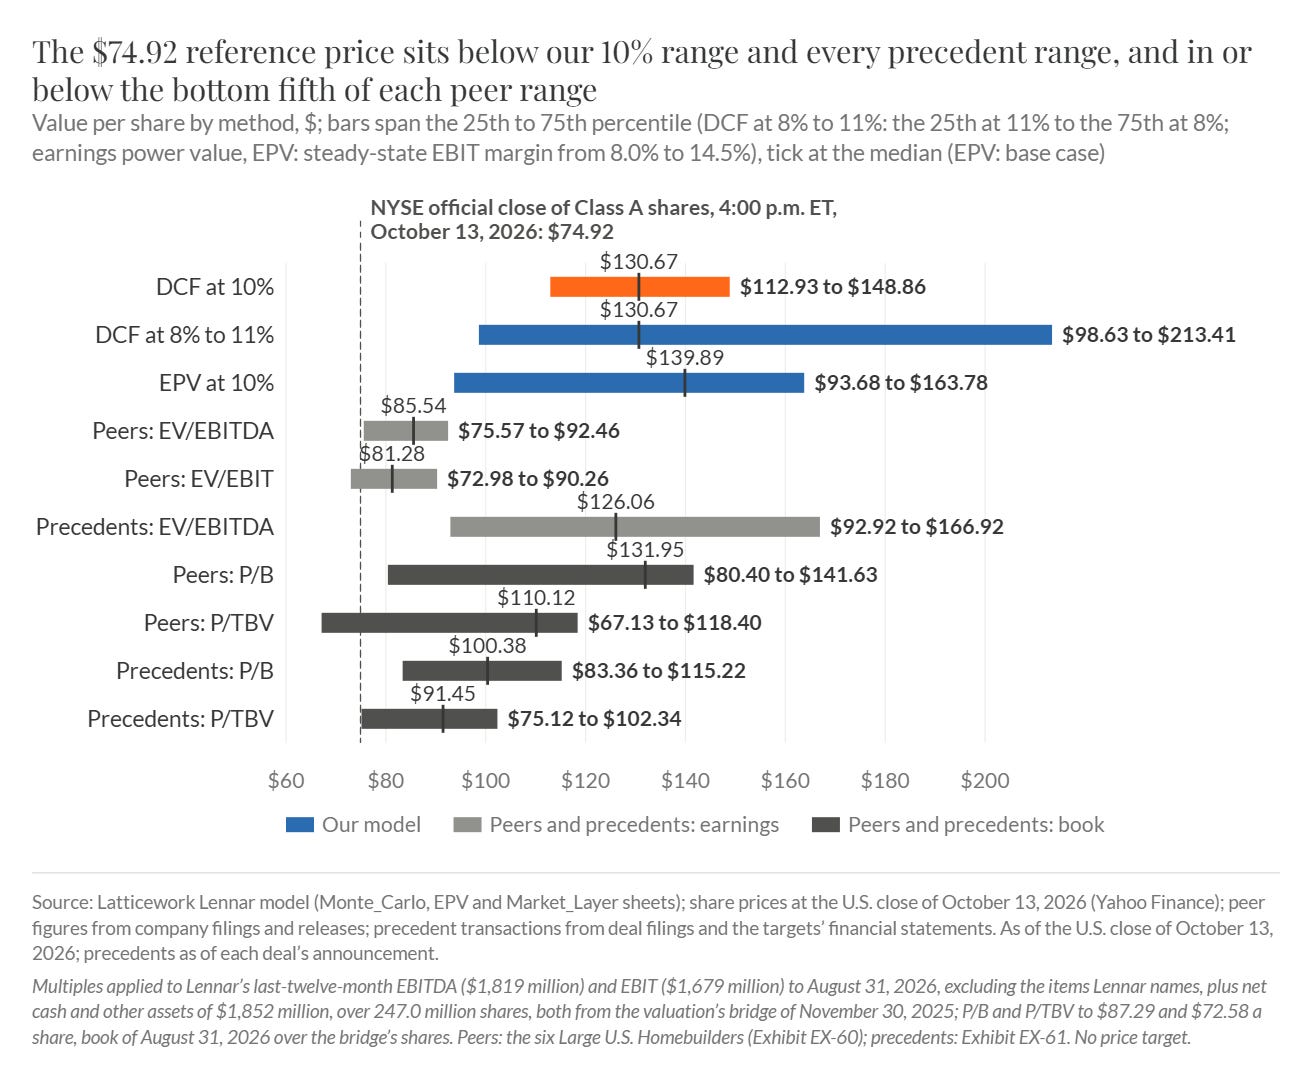
Value per share by method beside the reference price of $74.92 (Part XII, Chapter 46): it sits below our range at 10% and below every precedent range, and in or below the bottom fifth of each peer range.