

We are delighted to share with you the sixth in-depth research report in our Industry Primers series, this one on fertilizers. The series exists to help fundamental, long-term investors expand and deepen their circle of competence, one industry at a time, and your feedback on what was useful and on which industries to cover next shapes what we produce. The report is complemented by two podcast episodes, the first telling the story of the industry and the second digging deeper into the fundamentals from an investor’s standpoint. Below, you will find two PDF files for download: the research report (members only) and the accompanying slide deck (free to access). We start with a quick anecdote:
On August 18, 2010 (Australian time) BHP Group (ASX, LSE, NYSE: BHP) offered $130 a share in cash for PotashCorp, the Saskatchewan potash miner, about $40bn on a fully diluted basis. PotashCorp’s board rejected the offer, and on November 3, 2010 Canada’s industry minister found that the purchase was not likely to be of net benefit to Canada under the Investment Canada Act. BHP withdrew in mid-November.
PotashCorp kept building potash capacity sized to the prices of 2008, and it spent $9.8bn of capital in the five years 2009 to 2013. The new tonnes arrived as prices fell in 2013 and reached their low in 2016. On January 1, 2018 PotashCorp merged with Agrium into Nutrien (NYSE, TSX: NTR), and each PotashCorp share became 0.4 Nutrien share. At the close of September 25, 2026 those Nutrien shares were worth 67 cents for each dollar BHP had offered, before dividends.
In the same low point of the cycle, CF Industries Holdings (NYSE: CF), a nitrogen producer that owns no mine, bought its rival Terra Industries for $4.6bn in cash and shares, completing the purchase in April 2010. In February 2016 it sold about 11% of its nitrogen business to the farm cooperative CHS for $2.8bn, at an implied value twice what the market put on all of CF, and it spent the cash its plants earned on repurchasing its own shares. Its share count in August 2026 was 42% of the count it had after the Terra purchase. From its first trading day in August 2005 to September 25, 2026, CF returned 52 times its first-day price with dividends reinvested, against 9.3 times for the S&P 500 total return.
The report explains the gap through the way each nutrient is made and priced. Fertilizers are three commodity businesses whose costs are set by geology and by the price of natural gas. Nitrogen is made in chemical plants from gas, phosphate is rock dissolved in sulfuric acid and combined with ammonia, and potash is a salt dug from deep mines. A tonne of urea from Louisiana and a tonne from Qatar fetch the same price at the same port, so a producer earns the difference between that price and its own cost. Its place on its nutrient’s cost curve, the ranking of every producer from the cheapest to the most expensive, therefore decides its margin at every price.
At the World Bank’s August 2026 gas prices a Louisiana plant made a tonne of ammonia for about $161 in all and a Dutch plant for about $757. The price settles near the cost of the most expensive plants that must still run to meet demand, usually European plants on imported gas, so the Louisiana plant keeps most of the gap for as long as the world needs the European plants’ output. CF’s gross margin was 10.5% in 2017, when European gas cost $2.76 per million British thermal units (MMBtu) more than American gas over the year. In 2022, when the difference was $33.97, it was 52.4%.
Potash producers earn their margin from the ore body. In 2025 Nutrien sold potash for a net $252 a tonne at the mine and kept about $161 after its cash cost and Saskatchewan’s taxes, from mines paid for decades ago, while BHP’s new Jansen mine will cost about $2,024 of capital for each tonne of annual capacity. Phosphate’s margin depends on the sulfur and ammonia a producer buys. The Mosaic Company (NYSE: MOS) settled its third-quarter 2026 sulfur at $705 a long ton, 35% above the second quarter’s average, which adds about $72 to the cost of a tonne of diammonium phosphate (DAP). At the close of Friday, September 25, 2026, CF was worth $17.4bn, 2.4 times Mosaic’s $7.3bn.
The record shows how uneven the owners’ results have been. From their listings the four long-listed majors returned between 3.6% a year (Mosaic) and 20.6% (CF) with dividends reinvested, against about 11% for the S&P 500 total return. Without CF the other three averaged about half the market’s return. Over the twenty years from September 29, 2006, five of seventeen listed producers beat the index.
The report finds that capital allocation through the cycle, what managers built, bought, sold and bought back and at what point in the cycle, decided how much capacity stood behind each share more than the quality of any single asset did, while the date at which a record began decided whether it beat the index. Under Stephen Wilson, from CF’s listing to the end of 2013, its shareholders earned 15.1 times their money against 1.8 times for the index. His successor, Tony Will, cut CF’s share count by 45% to the end of 2025 and raised its ammonia capacity per share about 2.6 times. He took over after the stock had risen about fifteen-fold in eight years, and his shareholders earned 7.5% a year against 13.6% for the index.
The report sets the records of the owner-operators, the chief executives and controlling holders who ran these companies as owners, on one basis, and it finds that the variables behind the best of them were visible in advance: the entry price relative to the cycle, the cost position on the nutrient’s own curve, restraint at the peak and the debt carried into the low point. This primer is a manual for reading them. This is one of a weekly series of primers whose purpose is to help readers expand or deepen a circle of competence, one industry at a time.
The companion deck. Fertilizers: a self-contained summary of the report in slide form.

What’s inside
The primer has two parts, both attached to this post: the report and a companion deck that can be read on its own. The report follows the industry from its history and economics to its companies, its accounts, its valuation and its open questions, and every figure in it is dated and sourced in the notes. The highlights, part by part:
Part I, Orientation. Why the industry repays study, how its three nutrients are made and priced, and where they are mined, made and used. The 23 featured companies that trade on exchanges open to most investors were worth $247.8bn at the September 25, 2026 close. Four state-controlled Gulf producers made up $100.9bn of it, 41%, against $83.0bn for the nine Western fertilizer producers.
The four are the Saudi Arabian Mining Company (Tadawul: 1211), known as Ma’aden, SABIC Agri-Nutrients (Tadawul: 2020), Industries Qatar (QSE: IQCD) and Fertiglobe (ADX: FERTIGLB). Ma’aden alone, at $63.2bn, is about a quarter of the total, and its business includes aluminum and gold as well as phosphate. The largest company that makes only fertilizer is Nutrien, at $34.5bn.
Chapter 2 works the cost of a tonne of ammonia in Louisiana and the Netherlands from public numbers and fixes the units, because prices are quoted in tonnes of product and world statistics in tonnes of nutrient. At the World Bank’s August 2026 price of $390 a tonne of urea, a tonne of nitrogen bought as urea cost about $848. Chapter 3 maps the deposits, the plants and the buyers. Canada, Russia and Belarus mined 63% of the world’s potash in 2025, against 62.6% in 2000. Morocco and Western Sahara hold 68% of the world’s phosphate rock reserves, while China mined 44% of the rock. China, India and Brazil used half the world’s fertilizer in 2024, and Brazil has passed the United States.
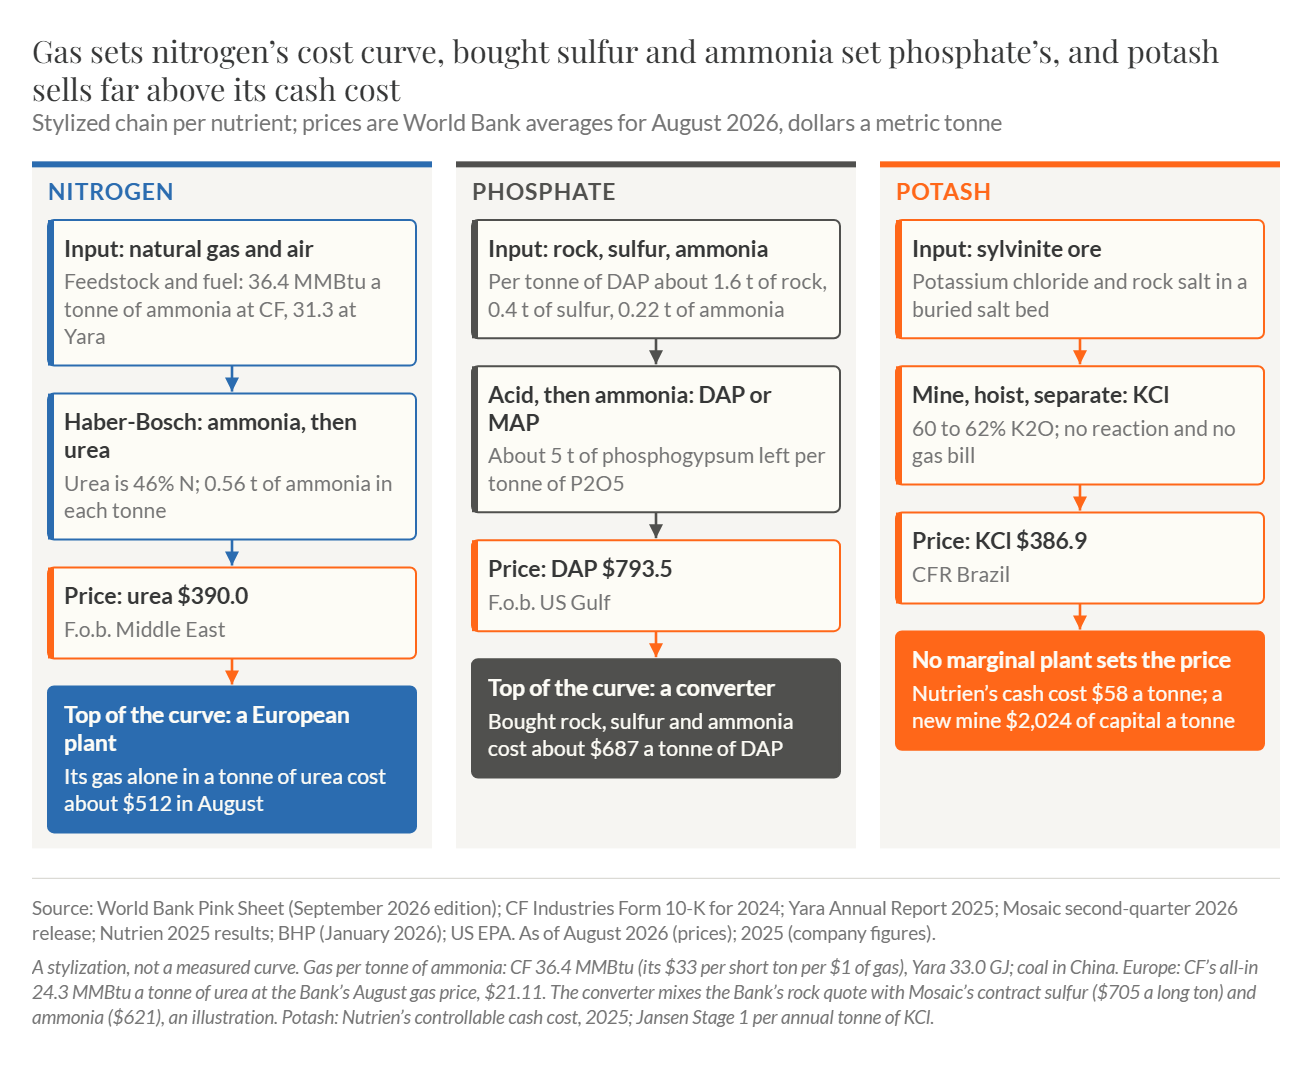
From Chapter 2: the input, the process and the World Bank price of August 2026 for nitrogen, phosphate and potash, with the top of each cost curve, drawn as a stylization rather than a measured curve. The gas alone in a tonne of urea made in a European plant cost about $512 against a urea price of $390. Nutrien’s potash cash cost of $58 a tonne compares with $2,024 of capital a tonne for a new mine.
Part II, Evolution. The history in three eras, chosen by where the nutrient came from. Until 1913 every nutrient came from a natural deposit that a state owned or taxed, from Peru’s guano and Chile’s nitrate to Germany’s potash; Morocco’s phosphate, a state monopoly from 1920, followed the same pattern. The first synthetic ammonia plant, at Oppau in Germany, began production on September 9, 1913. On the count of a study in the Bulletin of Latin American Research, Chilean nitrate’s share of world nitrogen consumption fell from 54.7% in 1913 to 32.2% a decade later. Nitrogen became a manufacturing business whose price follows the cost of making it, while phosphate and potash stayed with the owners of the deposits.
From 1945 to 2003 states and cooperatives built the mass industry. Saskatchewan’s floor price and production quotas of 1969 raised potash revenue per tonne of potassium oxide (K2O) by about 73% on 3% less volume. Canpotex, the export agency incorporated in 1970 and owned today by Nutrien and Mosaic, is the institution that survived. The American gas shock of 2000 to 2003 bankrupted Farmland Industries and Mississippi Chemical, and Koch offered about $104m for four of Farmland’s plants, about $58 per annual tonne of capacity on the price reported at the offer.
The price spike of 2008 was short, and the capacity it prompted kept arriving for years. CF decided its one expansion in 2012 with urea at $399 a tonne on the World Bank’s annual series and started the plants in 2016, when urea averaged $194. On July 30, 2013 Uralkali, whose London depositary receipts traded until December 22, 2015, stopped exporting through the Belarusian Potash Company, the agency it shared with Belaruskali. On the World Bank’s series, which showed the break six months late, potash averaged $344.8 a tonne over the twelve months after the exit against $429.4 over the twelve before, a fifth less.
The Strait of Hormuz has been effectively closed to commercial traffic since March 2, 2026. Urea rose 81.5% from February to April 2026, to $856.9 a tonne. By August it had fallen 54% while the strait stayed shut, and DAP had risen 26.7% since February, to $793.5, and was still rising. Chapter 8 tells four cases as the decisions their owners took: PotashCorp’s building and the BHP bid, the break of the eastern potash cartel, CF from its listing to 2026, and Sirius Minerals, taken over by Anglo American (LSE: AAL) in March 2020 for about £405m after its bond financing failed, on a mine into which $1.1bn had been invested.
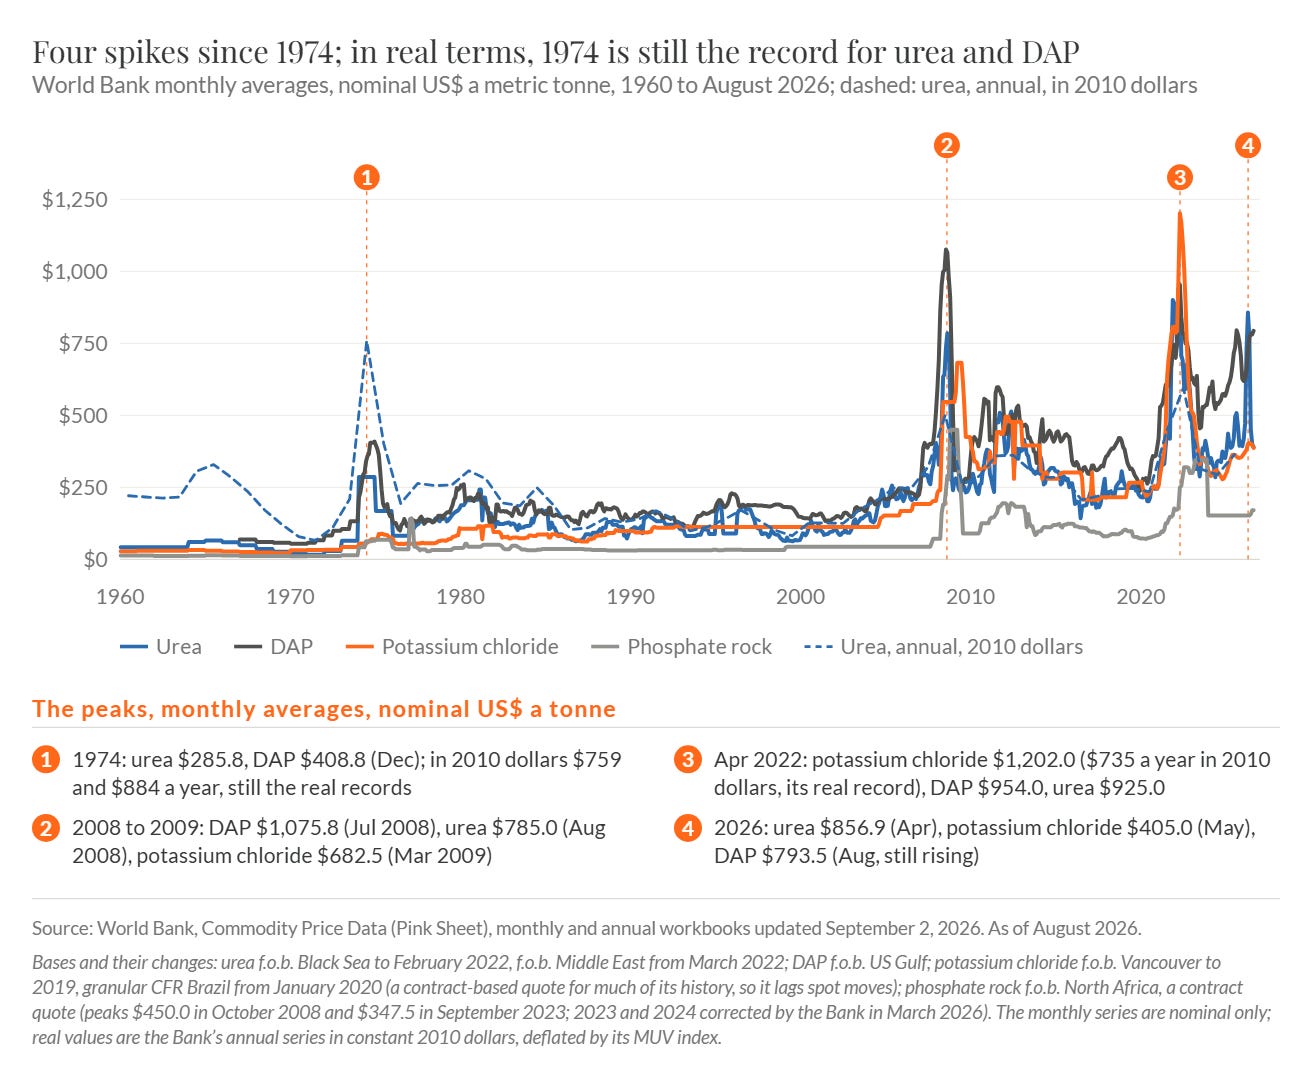
From Chapter 6: the World Bank’s monthly prices of urea, DAP, potassium chloride and phosphate rock in nominal dollars a tonne from 1960 to August 2026, with urea’s annual price in 2010 dollars. Of the four spikes, in 1974, 2008, 2022 and 2026, the first is still the record in real terms for urea and DAP, at $759 and $884 a tonne in 2010 dollars.
Part III, Structure & Economics. Where the profit goes from the gas well to the farm, how the cycle turns, what each nutrient earns in dollars a tonne and which advantages have lasted. The producer’s share of the profit rises and falls with the scarcity of its input, while the retailer’s share holds. From 2018 to 2025 the adjusted EBITDA of Nutrien’s retail segment varied with a coefficient of variation of 0.21, against 0.56 for its potash segment. In Illinois the distributors between the export price or the plant gate and the dealer took 29 to 37% of the farmer’s price for urea and ammonia in both 2022 and 2025.
The farmer buys once a season and with the grain price in mind. A tonne of urea cost 4.0 tonnes of maize in April 2026, the highest monthly reading since 2000, and 1.74 tonnes by August. Nitrogen is applied every year while phosphate and potash can be skipped for a season, which is why the demand cuts of 2026 fell on phosphate.
Chapter 11 works nitrogen from the gas price. A tonne of ammonia takes 31 to 36 million Btu of gas, so each dollar of difference between European and American gas is worth about $36 a tonne at CF’s gas use. In August 2026 the World Bank’s European gas price exceeded the US price by $18.34 per MMBtu, the widest month since December 2022, which is about $667 a tonne of ammonia. The world’s demand for European output decides how much of that gap the price passes on. CF earned gross margins of 46 to 51% in 2011 to 2013. On similar gaps in 2023 to 2025 it earned 34.6 to 38.5%, because after the American plants built in 2016 and 2017 the world needed Europe’s ammonia less.
New ammonia plants cost about $2,600 to $2,900 a tonne of annual capacity. CF’s management gave its assumptions for an average year of the cycle on its second-quarter 2026 call as $3.50 gas and a 10% to 12% return. On them a new Louisiana plant needs at least about $450 to $505 a tonne of ammonia before its capital is repaid, the authors’ estimate. CF realized about $521 a tonne in 2025 and $376 in 2016.
Chapter 12 works potash and phosphate. At Nutrien’s 2025 margin of about $161 a tonne, a tonne of Jansen capacity would take about 12.6 years to repay its capital. On August 2026 prices a phosphate producer that buys its rock, sulfur and ammonia lost money on DAP at $793.5, while one that mines its own rock kept about $173 a tonne more. Chapter 13 finds that most producers have no lasting advantage beyond their place on a cost curve, with the ore body as the exception: in the 2016 low PotashCorp and Mosaic stayed profitable while CF, which owns no mine, lost money.
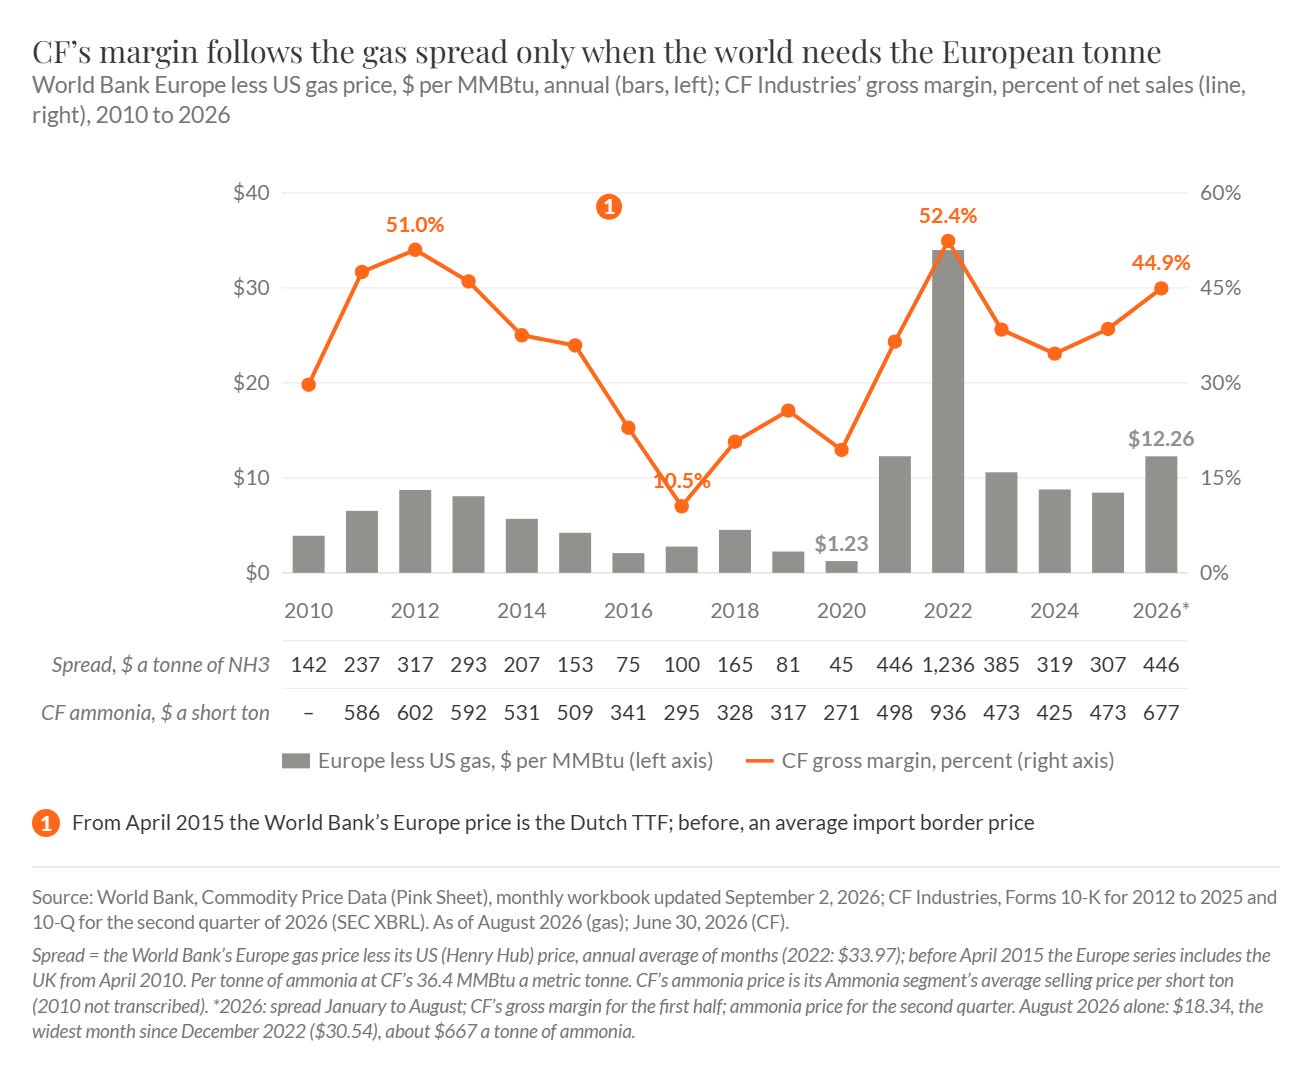
From Chapter 11: the World Bank’s European gas price less its US price by year, in dollars per MMBtu (bars), against CF’s gross margin (line), 2010 to 2026. CF’s margin was 10.5% in 2017 on a gap of $2.76. In 2022 it was 52.4% on a gap of $33.97, and it was higher in 2011 to 2013 than in 2023 to 2025 on similar gaps.
Part IV, The Players. The featured producers on one page at one date, two chapters on the builders, the allocators and the state’s managers, and the unlisted and state forces. The producers sort by their nutrient’s cost curve and their place on it. CF earned operating income plus depreciation of 45% of its FY2025 sales on American gas, while Grupa Azoty (WSE: ATT), Poland’s state-controlled producer on European gas, earned a trailing EBITDA margin of 6.9% and carries net debt nearly six times its market value. Yara International (OSE: YAR) agreed on July 2, 2026 to acquire the Gulf Coast Ammonia plant at Texas City, still in commissioning, for about $1,000 a tonne of capacity.
Chapters 15 and 16 put every leader’s record on one basis, total shareholder return over the tenure against the S&P 500 total return over the same window. The three tenures that spanned the boom of 2003 to 2008 beat the index. Wilson’s CF returned 15.1 times against 1.8 for the index. Bill Doyle’s PotashCorp, measured from December 2000, returned 10.2 times against 1.9, and Jim Prokopanko’s Mosaic beat the index by a narrow margin.
Every chief executive’s window in the set that began in 2014 or later and lasted more than a year trailed the index. CF’s letter for 2014 set out the rule its managers followed, to spend cash on capacity and on buybacks so that the cash flow each share can generate rises as far as possible, and CF bought back $8,768m of its stock from 2014 to 2025. Nassef Sawiris sold nearly all the plants of OCI N.V. (Euronext Amsterdam: OCI) in 2024 and 2025 and paid out about $7bn, and a holder since the 2013 listing still has 0.83 times the money in euros.
Chapter 17 covers the state as producer, buyer and regulator. Eleven of the 23 featured companies have a state or a state company as controlling or largest holder, and they carry 58% of the featured value. India budgets ₹1.71 lakh crore net for fertilizer subsidies in 2026-27, about $17.8bn. Producers inside the Strait of Hormuz shipped 26.9% of traded urea in 2024 on UN Comtrade’s data, a share other sources put at up to a third.
The chapter also sets out the antitrust matter, two investigations and one consolidated set of private suits, all allegations the companies deny. Bloomberg reported the Justice Department’s investigation on March 4, 2026, and the Federal Trade Commission announced its own on May 28. On June 9, 2026 the Judicial Panel on Multidistrict Litigation centralized five farmer suits as MDL No. 3187 before Judge Eric F. Melgren in the District of Kansas, and 29 related suits have followed them there. The defendants include CF, Nutrien, Mosaic, Koch and Yara entities and Canpotex. No charge has been filed, and no court has ruled on the merits.
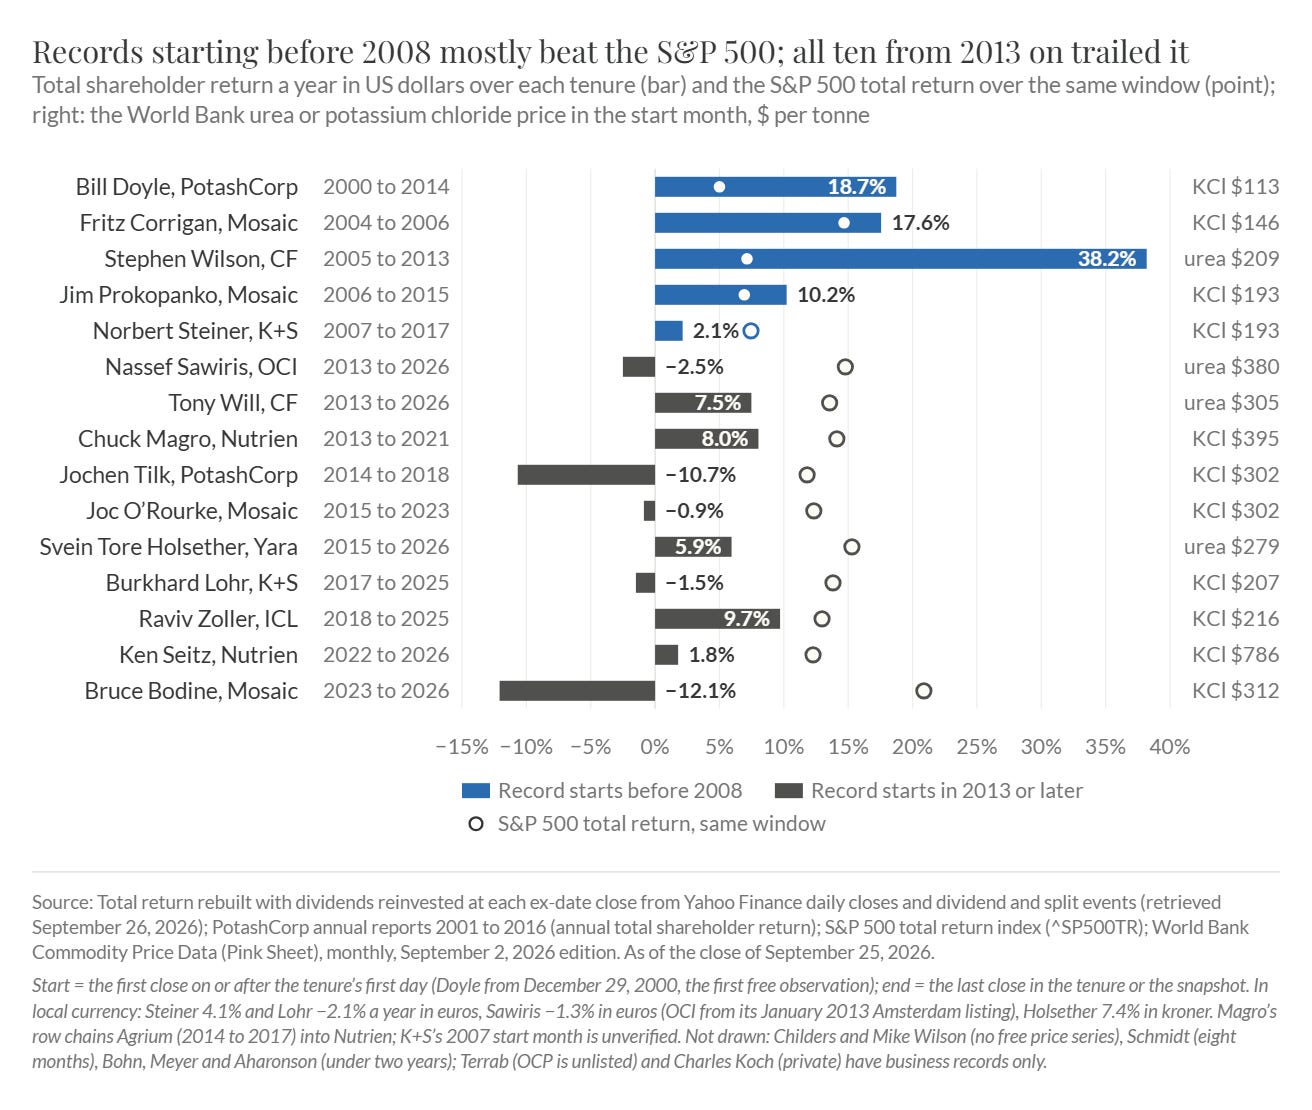
From Chapter 15: total shareholder return a year in US dollars over each chief executive’s tenure (bars) against the S&P 500 total return over the same window (points), with the World Bank urea or potassium chloride price in the month each record starts. Stephen Wilson’s CF returned 38.2% a year from 2005 to 2013, and all ten records in the chart that start in 2013 or later trailed the index.
Part V, Speaking the Language. The reference section: the units, terms and measures with their competing definitions, the accounting for mines, waste stacks, hedges and minority partners, and a tour of the filings and free data in the order a specialist reads them. Two analysts can quote the cost of the same potash mine from the same release and differ by 64%, because Jansen costs $2,024 per annual tonne of potassium chloride and $3,318 per tonne of K2O. Nutrien’s potash cash cost is $58, $65 or $91 a tonne, depending on what the definition leaves out.
Chapter 19 names three numbers the income statement hides: the reserve behind the depletion charge, the cost of closing mines and the stacks of phosphogypsum, the waste left from making phosphoric acid, and the claims of minority partners between EBITDA and the shareholder. Mosaic’s asset retirement obligations, its discounted cost of closing mines and stacks, rose from 8.8% of its equity in 2015 to 21.5% in 2025, mostly through revisions of estimate. Adding them, $2.6bn at the end of 2025, to Mosaic’s enterprise value lifts its multiple of EBITDA in an average year of the cycle, its mid-cycle multiple, from 5.7 to 6.9 times. International accounting rules let Nutrien reverse $780m of phosphate impairments in the 2022 spike, a gain a company reporting under US rules could not have booked.
Chapter 20 reads the filings. CF’s second-quarter 2026 gas cost of $3.37 per MMBtu, set against the World Bank’s European average of $15.58, put it about $440 a tonne of ammonia ahead at its own gas use. The bond prospectus of OCP, Morocco’s state producer, shows its net debt up 45% in 2024 to its own ceiling of 2.5 times EBITDA.
Part VI, Analysis & Valuation. A producer is analyzed from its cost position upward and from its owner downward. In 2025 a Gulf Coast ammonia plant on CF’s gas use burned about $128 of gas a tonne, against about $413 for Yara’s European plants. Mid-cycle earnings depend on the years averaged: Yara’s short window overstated its normal EBITDA by 19%, and CF’s management uses a baseline 18% above CF’s eleven-year average.
At the September 25, 2026 close the nine Western fertilizer producers traded at a median of 6.3 times mid-cycle EBITDA, from K+S (XETRA: SDF) at 3.9 times to LSB Industries (NYSE: LXU) at 11.0. CF stood at 8.6 times its eleven-year average and 7.3 times management’s baseline of about $2.9bn. The difference between the two is about $3.2bn of equity value. A multiple of a single year’s earnings misleads at the top and the bottom of the cycle. At the end of March 2022 the majors traded at about 6 to 7 times the 2022 earnings they went on to report, and at the end of 2016 PotashCorp traded at 48 times its 2016 earnings.
Against the cost of new capacity, Nutrien’s potash is valued at about $755 per tonne of capacity, 37% of Jansen’s $2,024. CF’s enterprise value of $2,235 per tonne of ammonia capacity is 78 to 85% of the cost of Blue Point, its new Louisiana plant. The Gulf producers trade above their own cost of building new plants.
Chapter 23 measures what a buyer of fertilizer stocks chosen without selection has earned. The median of the seventeen ranked producers, Qinghai Salt Lake Industry (SZSE: 000792), returned 4.94 times over twenty years, a little over half the index. From 2019 to 2025 a falling multiple cost every major 5.5 to 12.6 points of return a year. The entry price relative to the cycle was the strongest predictor of the return, followed by the cost position, restraint at the peak and leverage, while retail integration, size and a nutrient’s scarcity predicted nothing. The report treats this evidence as suggestive, because it rests on seventeen companies over one cycle.
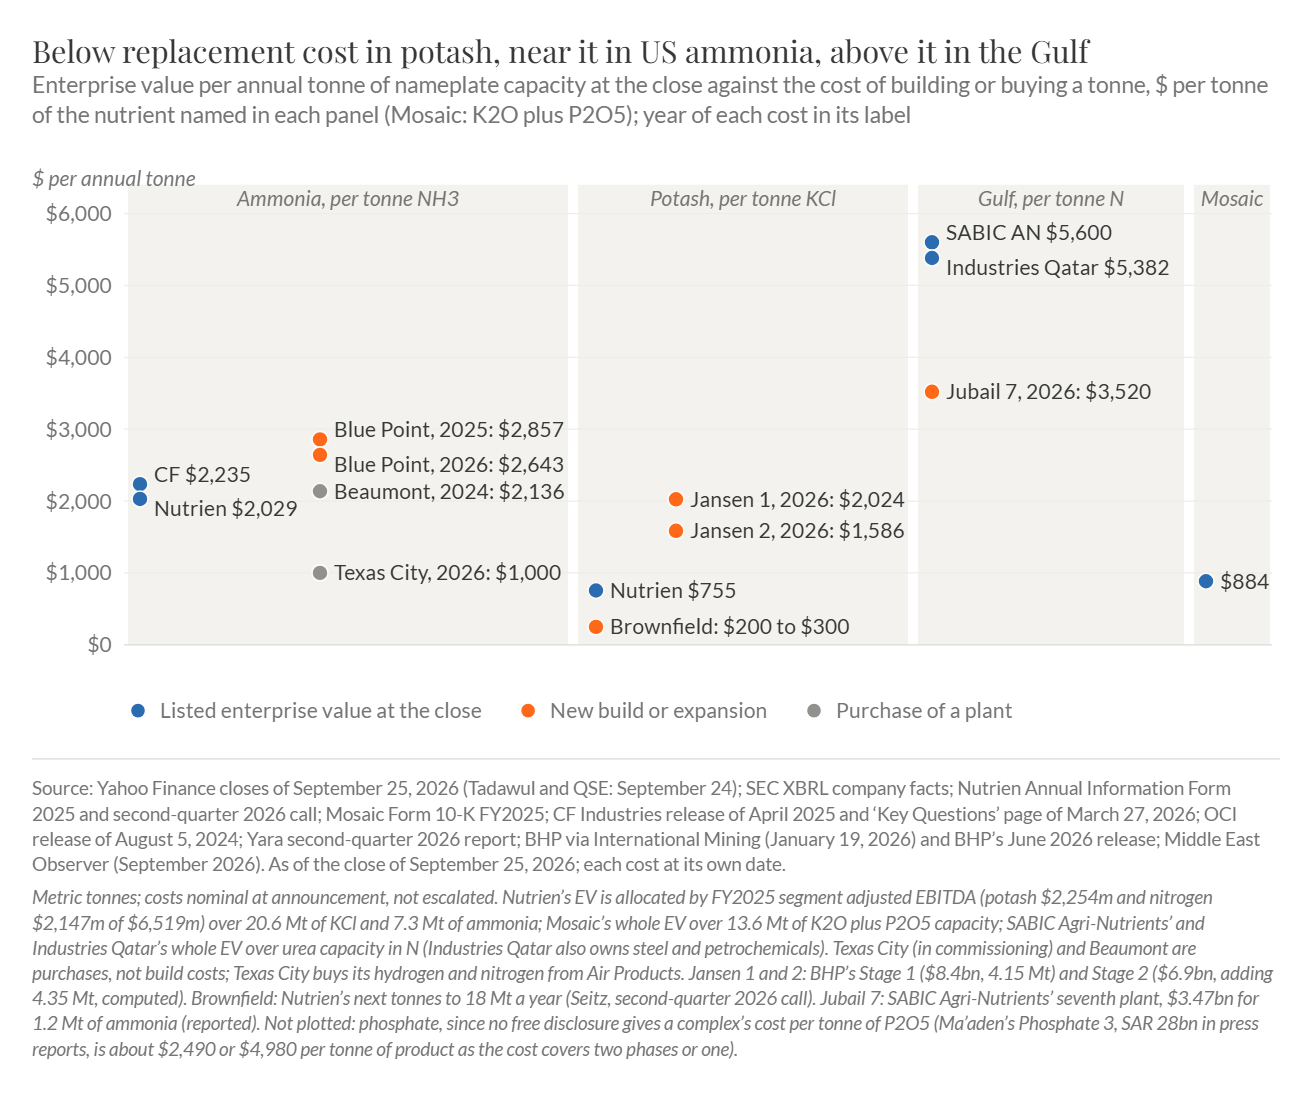
From Chapter 22: enterprise value per annual tonne of capacity at the September 25, 2026 close against the cost of building or buying a tonne, by nutrient. Nutrien’s potash is valued at $755 a tonne against $2,024 for BHP’s Jansen Stage 1. CF’s ammonia is valued at $2,235 a tonne against $2,643 to $2,857 for Blue Point on CF’s two dated estimates.
Part VII, The AI Inflection. The part counts only what the filings measure. Nutrien mined 53% of its potash ore with automation in the first half of 2026, against 22% in 2023. The value of that automation lies in the capital it saves, since Nutrien prices the next tonnes from its existing mines at $200 to $300 of capital, against about $2,024 at Jansen, and no filing has yet turned it into dollars a tonne.
The farm software platforms set digital targets and missed them. Nutrien’s digital share reached 18% of its North American retail sales in 2022 against a target of more than 50%. Yara counts 25 million digitized hectares against a goal of 150 million. On the farm, precision application has cut the nitrogen used per bushel of US corn by about 1% a year while the rate per acre rose.
For the producers the larger question is the price of American gas, for which data centers now compete. A $2 rise in the Henry Hub price would take about a quarter of 2025’s gap between European and American gas and almost all of 2019’s, although the September 2026 outlook of the Energy Information Administration has Henry Hub falling to $3.28 in 2027 as production outgrows exports of liquefied natural gas and power demand.
Part VIII, Risks & Debates. Fertilizer producers fail when a high cost position or a single asset meets a price collapse with debt. The American cooperatives failed on gas in 2002 and 2003, Sirius Minerals on a bond in 2019, and in 2026 the Gulf plants whose only route was a closed strait. No producer listed in North America or Europe in 2005 has failed since. The shareholder’s usual loss is a dividend cut in the low years after borrowing in the good ones, and Mosaic cut its quarterly dividend by 91% in seven months in 2017. Mosaic’s undiscounted cost of closing its phosphogypsum stacks, about $3.0bn at the end of 2024, equals about 41% of its market value.
Chapter 27 works the open debates of 2026, facts first and proponents named, with the dates to September 2027 that will settle them. On the US Geological Survey’s estimates, world potash capacity grows 17% by 2029, so output must grow about 4% a year to hold 2025’s operating rate. Urea fell 54% from its April peak with the strait still shut, so the debate over the Gulf producers turns on whether buyers will pay more for supply from outside the Gulf. In the antitrust debate, which concerns investigations and allegations the companies deny, the plaintiffs allege that record prices drew no increase in supply, and CF answers that it ran at 97% of its gross ammonia capacity in 2025. A charge or a closing statement from the Justice Department or the FTC, and Judge Melgren’s rulings, will settle it.
The appendices. The investable universe, 69 listed companies with the restricted Moscow listings and the unlisted producers set out beside them; a checklist of 30 questions for the analyst in ten groups, from the producer’s cost curve to the proxy statement, with the place to look and what the record shows for every question; a reading course that opens with the producers’ own letters and calls, followed by books, the government and multilateral data series, the trade bodies’ statistics and interviews; and the numbered notes that source the report.
The companion deck. The report in the format of the Monday Morning Briefing, designed to be read without the report: the propositions of the Executive Summary with the number that carries each, the report’s exhibits re-rendered for the slide format under titles that state what each shows, the tables that carry the argument, and slides for material that has no exhibit in the report, followed by the universe and the checklist.
What the primer is for. A reader who works through it should be able to explain how fertilizers make money, from the gap between European and American gas and the margin of a mine whose capital was repaid decades ago to the retailer’s margin on each tonne; use the industry’s vocabulary, from product and nutrient tonnes, short, long and metric tons and the gas used per tonne of ammonia to the controllable cash cost and the obligation to close a stack; read the filings without being misled by a cost quoted per tonne of product where the argument needs the nutrient, a mid-cycle figure without its years, or an EBITDA that includes a minority partner’s share; appraise a producer the way specialists do, from its place on its nutrient’s cost curve upward and against mid-cycle earnings and the cost of a new tonne; and recognize the managers and business models that have compounded value over decades, and the ones that built capacity at the top of the cycle.
How to use this primer
The report does not need to be read in order. Suggested paths:
a generalist with limited time, Parts I and VI plus the checklist in Appendix B;
a reader interested in the history, Part II;
an accountant, Part V with Chapter 12;
an analyst working on a specific company, Chapter 14, then Parts III, V, and VI in order;
a commodity specialist, Chapters 10 to 12 and the debates of Chapter 27;
a risk officer, Part VIII with Chapters 8 and 17;
a technologist, Part VII;
a reader who came for the owner-operators, Chapters 15 and 16, with Chapter 23 for what their records are worth against the index.
Every chapter ends with a “What to remember” box, and the boxes read in sequence summarize the report. The checklist follows the order of the analysis in Chapter 21, from the producer’s place on its nutrient’s cost curve to the owner and the proxy statement, and its first questions test the cost position because in 2025 a Gulf Coast ammonia plant on CF’s gas use burned about $128 of gas a tonne, against about $413 for Yara’s European plants.
Feedback and requests
Please reply to this email or leave a comment with what was useful, what was missing, any errors you find, and the industries you would like covered next. Member requests will inform the order of coverage.
This content is published by MOI Global for educational purposes only. It is not investment advice, an offer, or a solicitation, and no security mentioned herein is recommended for purchase or sale. The publisher and contributors may hold positions in securities discussed. Figures are believed accurate as of the dates stated but are not warranted; readers should verify all data against primary sources before relying on it. Nothing herein constitutes legal, tax, or accounting advice.